Precious metals have been a bit boring of late due to some sideways trading.
BUT that boredom may come to an abrupt end shortly!
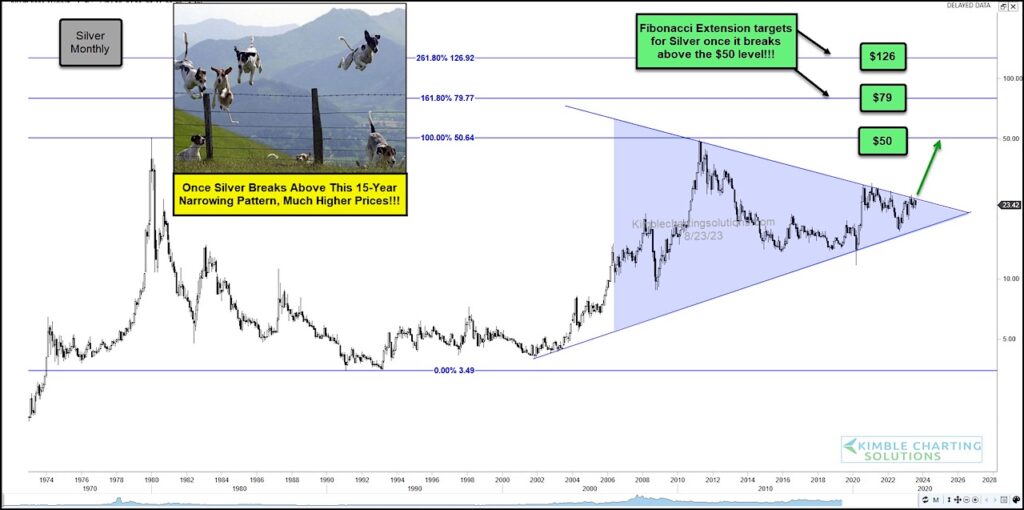
Today’s chart takes a long-term view of Silver, highlighted a huge price pattern along with potential upside targets (if triggered).
As you can see, Silver has formed one of the longest and largest pennant patterns that has been in play for nearly 15-years. If Silver breaks out, look for it to become VERY attractive to investors. This may propel Silver back to retest its all-time highs.
And if Silver takes out $50, much higher Fibonacci extension levels come into play at $79 and $126.
But first, let’s see if Silver can break out of its 15-year pennant. Stay tuned!
Silver Prices long-term “monthly” Chart

Note that KimbleCharting is offering a 2 week Free trial to See It Market readers. Just send me an email to services@kimblechartingsolutions.com for details to get set up.
Twitter: @KimbleCharting
Any opinions expressed herein are solely those of the author, and do not in any way represent the views or opinions of any other person or entity.


