When silver, gold, and the precious metals industry were on red-hot bullish in the 2000’s, investors could do no wrong.
You could buy silver at just about any price and it would go higher.
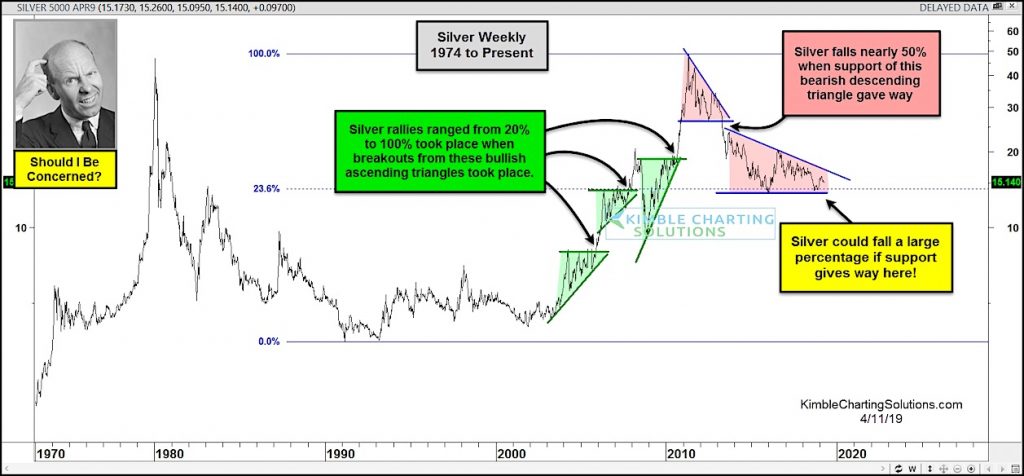
In today’s chart, you can see three large green bullish ascending triangles from the 2000’s that lead to big gains. But that was the bull market before the current bear market.
The tables have turned since the 2011 price top. Silver quickly formed a bearish descending triangle and fell another 50 percent when that broke down. This sent a vicious bear market message to investors.
Now silver has formed another bearish descending triangle. And the price of silver could stand to decline a large percentage if support fails to hold again.
Needless to say, this is a big support test for Silver!
Silver “weekly” Price Chart

Note that KimbleCharting is offering a 2 week Free trial to See It Market readers. Just send me an email to services@kimblechartingsolutions.com for details to get set up.
Twitter: @KimbleCharting
Any opinions expressed herein are solely those of the author, and do not in any way represent the views or opinions of any other person or entity.


