Over the past week the financial markets have been filled with Federal Reserve news and noise about interest rates.
So what do we make of the action? Let’s look at the charts…
From a short term perspective, there have been plenty of gyrations in the bond market. But from a longer-term perspective, my overall stance that a MAJOR LOW in interest rates has taken place is still possible.
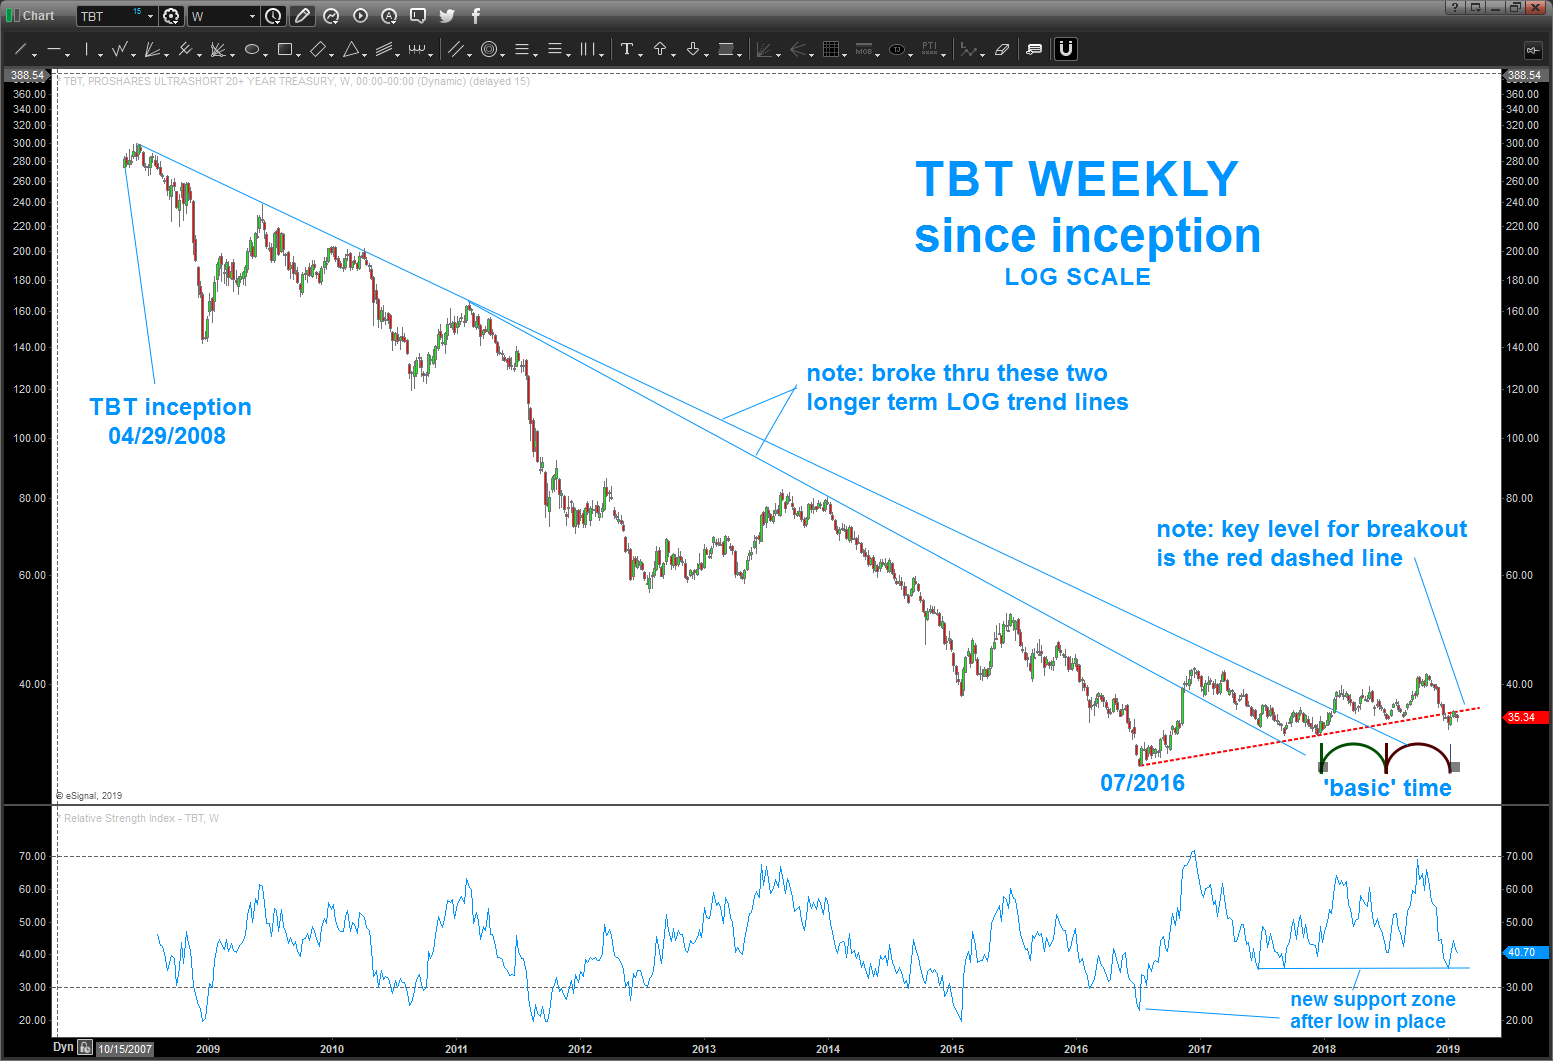
One way to see this is through the short treasuries ETF (TBT). In translation, it’s also long interest rates. But not that it’s a 2x ETF, so only experienced traders should use this as a trading instrument.
As you can see in the below chart, it most recently banged into “polarity” LOG resistance. This is where former Support becomes Resistance (or vice versa).
Our big test is a weekly close above the dashed red line. From there we would then pay attention to the formidable gap on the daily chart (38.40-39).
From a bullish perspective we have two developments:
- Note the weekly 14 period RSI. It has shifted to a new support zone. This is a bullish indication – as long as we stay above this level.
- Basic time analysis show the most recent low hitting on this low cycle.
If you would like to follow the analysis on TBT please see the following links:
- https://www.seeitmarket.com/rising-treasury-bond-yields-could-fuel-tbt-breakout-17614/
- https://www.seeitmarket.com/short-bonds-etf-tbt-breaks-out-on-rising-treasury-yields-17776/
- https://www.seeitmarket.com/treasury-bonds-interest-rates-short-term-outlook-tbt-tlt-october-22/
- https://www.seeitmarket.com/analyzing-year-end-rally-treasury-bonds-tlt-tbt-18786/
As always, thanks for reading.
Be sure to check out my unique analysis of stocks, commodities, currencies over at Bart’s Charts. Stay tuned and thanks for reading.
Twitter: @BartsCharts
Author does not have a position in mentioned securities at the time of publication. Any opinions expressed herein are solely those of the author, and do not in any way represent the views or opinions of any other person or entity.


