 By Andrew Nyquist
On Friday, I blogged about JP Morgan’s (JPM) trading losses and why the news came at a bad time for both the financials and the market in general. Many folks were using the news as a reason to buy… a contrarian signal per se. And although I was tempted to deploy some of my cash hoard as well, the technical ebb and flow of this downturn was telling me “not yet.” So I went home with my lone position in the Gold Miners (GDX) over the weekend.
Here are two technical reasons that played a part in my decision-making:
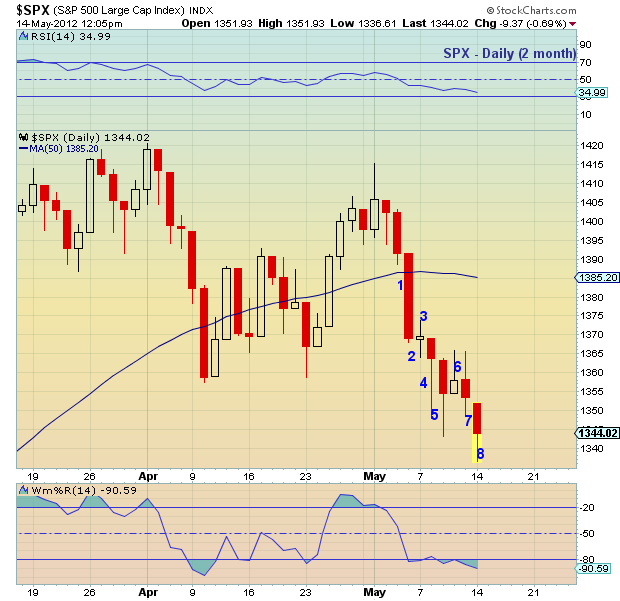
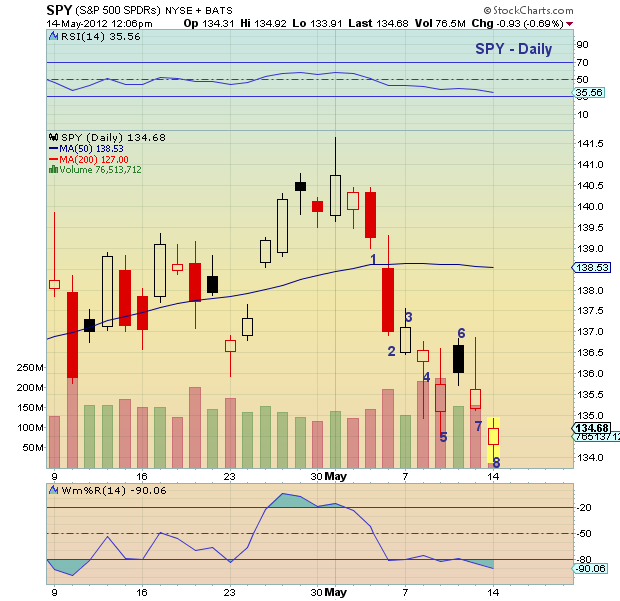
1) DeMark Analysis: The daily barcharts for both the S&P 500 (cash index: SPX) and the etf SPDR S&P 500 (SPY) were only on bar 7 of a Demark buy setup on Friday — that meant that Monday (today) or Tuesday would need to record a new LOW if that was to “perfect.” That occurred today.
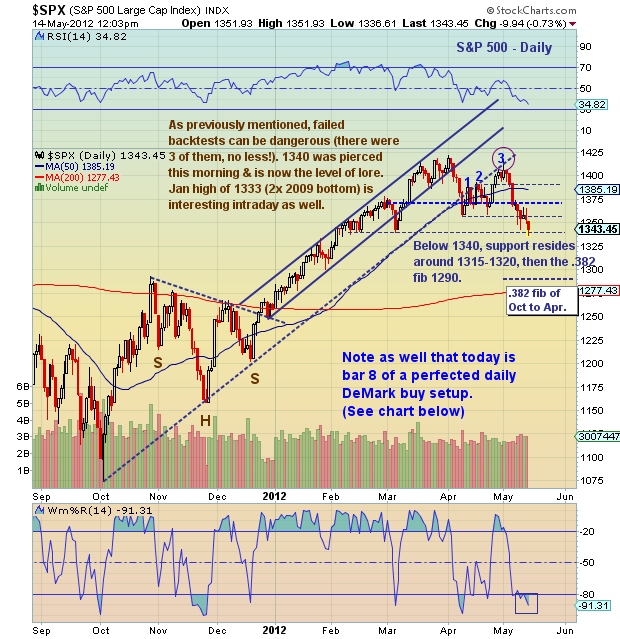
2) 1370 was technically “broken” on the S&P 500. In short, after breaking down below 1370, the index was unable to quickly retake the level on a closing basis. This was a sign of near term weakness.
So on to the good stuff… Or rather, some less depressing stuff. It appears that a short-term “tradable” bottom may be in, or nearing (i.e. this week). Many stocks are reaching extreme levels and are nearing attractive price points for a bounce higher. And with the S&P 500 recording a new low today and readying to record bar 8 of a 9 DeMark daily buy setup, this week may be a good time to review your short list of stocks for a trade or staged position build.
Furthermore, the upcoming Facebook (FB) IPO may provide some market interest and offer up a catalyst of sorts. Stocks that may benefit from the Facebook IPO and buzz include Fusion-io (FIO), Zynga (ZNGA), and Renren (RENN) to name a few. Another catalyst could be beaten-down commodities; sectors such as energy and precious metals (and related stocks) are reaching short-term extremes and overdue for a bounce.
Either way, it’s another day in the red (so far) so caution is still warranted. Probably a good idea to buy in increments and employ stops.
Trade safe and happy trading.
Chart #1 S&P 500 – SPX Technical levels
Chart #2: S&P 500 – SPX with DeMark Setup Counts
Chart #3: SPDR S&P 500 (SPY) with DeMark Setup Counts
———————————————————
Twitter: @andrewnyquist and @seeitmarket Facebook: See It Market
Position in GDX.
Any opinions expressed herein are solely those of the author, and do not in any way represent the views or opinions of his employer or any other person or entity.


