Granddad Russell, a rally whoa!
How much further will you go?
And can your wife Gran Retail soar?
Or will XRT stop at forty-four?
Hope you like my poem.
The entire modern economic family of ETFs has enjoyed the recent rally. And why wouldn’t they?
In the sentiment of value versus growth, much of the Economic Modern Family is value related.

Yesterday I stated that “for a sustained comeback (in value), we need to see more evidence of a reaccelerating of global growth, or a full-blown recession that forces a repricing of growth stocks.”
Since a lot of the answer to that question will depend on what happens with the tariffs, I thought we would expand our poem from one verse to two.
Vanguard’s value versus growth
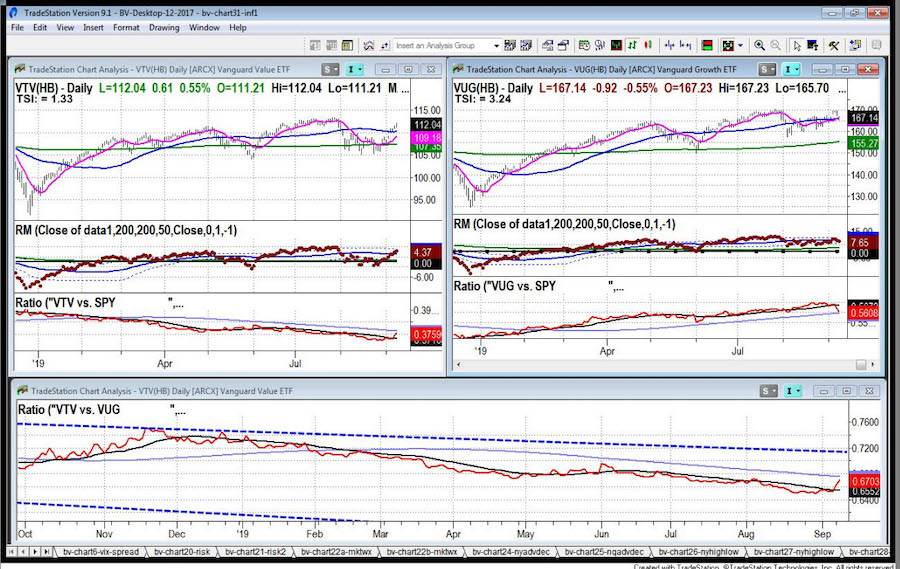
Here’s a chart that shows them both
Has the trend reversed for real?
Or have we hit an achilles heel?

On the left side of the daily chart (above) is the Vanguard Value Index (VTV). Beneath that is our proprietary Real Motion indicator. And below that the ratio between VTV and the S&P 500 ETF (SPY).
VTV entered into a bullish phase last week when it cleared the 50-DMA (blue line). The real motion indicator shows that it cleared resistance at the same time.
The ratio between SPY and VTV indicates a switch favoring VTV, but with a lot of resistance overhead.
On the right side is VUG (growth). It nearly broke the 50-DMA on the daily chart, but has come back to clear it, hence remaining in a bullish phase.
In contrast to VTV, VUG has lost momentum according to our RM indicator. It has also begun to underperform the SPY as shown on the ratio chart.
The bottom chart is the ratio between value and growth.
The price crossed a short-term moving average represented by the black solid line. However, the real breakout happens when and if price clears the solid blue line or the longer-term moving average.
Similar to what I showed you with the silver to gold ratio a while ago, that breakout will be more compelling.
As far as the fundamental implications, I’ve been lookng for a reflation scenario led by zero rates and currency wars. Does that lead to reacceleration of global growth?
Perhaps.
The full-blown recession theory is another one many economists are calling for.
Also possible, but will value continue to outpace growth in that scenario?
That’s an answer yet to know
That’s what charts will clearly show
So for now, follow the short-term trend
And find the value until the trend unbends
S&P 500 (SPY) – 300 resistance cleared at the end of the day with ATH 302.23. We could see a gap up over 300 tomorrow. If not, must hold 298.
Russell 2000 (IWM) – 155 now the closest pivotal support-plus, we are near our target profit area with this move. 158 is price resistance.
Dow Jones Industrials (DIA) – 270 cleared-now pivotal support
Nasdaq (QQQ) – 190.55 now pivotal support. 195.55 ATH
KRE (Regional Banks) – The 50-WMA at 53.01 cleared. Now super pivotal.
SMH (Semiconductors) – 121.40 pivotal support and then ATH 123.56
IYT (Transportation) – 192.57 pivotal support and 194 some resistance.
IBB (Biotechnology) – The 200 WMA at 102.65 now major support with resistance at 105 or the 50-DMA.
XRT (Retail) – Confirmed accumulation phase. But more importantly, tested 44.00-we will see if this spells the top of the move or not.
Twitter: @marketminute
The author may have a position in the mentioned securities at the time of publication. Any opinions expressed herein are solely those of the author, and do not in any way represent the views or opinions of any other person or entity.


