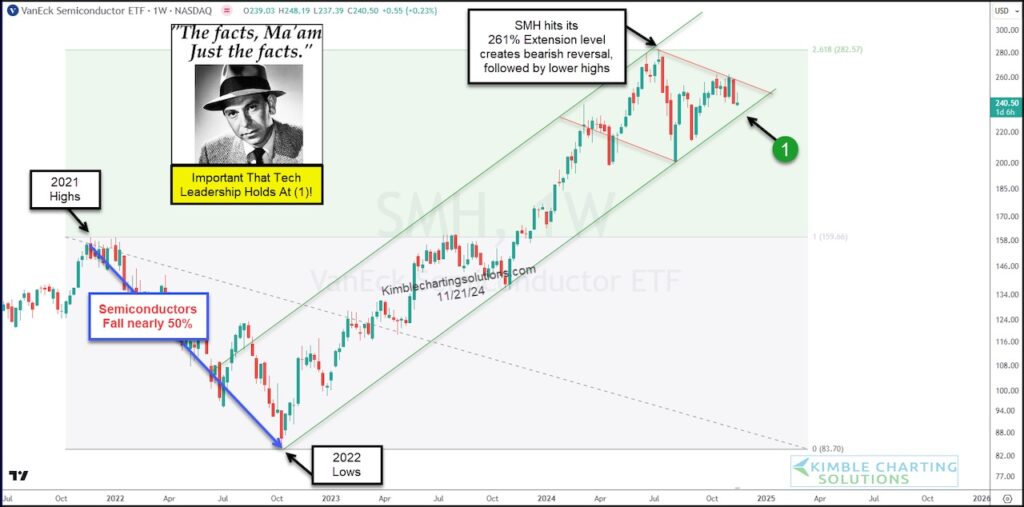
For much of the past two years, the Semiconductors sector has lead the Nasdaq and S&P 500 higher. Lead by Nvidia, the Semiconductors have been a market force displaying strong leadership for tech stocks.
But the past four months or so have seen the Semiconductors sector ETF (SMH) pull back, perhaps in a consolidation pattern. Or perhaps in the start of a bigger pullback.
Today we look at a “weekly” price chart of SMH to highlight what we are watching.
“The facts, Ma’am. Just the facts.” – Joe Friday
As you can see, SMH is pulling back within its rising up-trend channel that dates back to its low in 2022.
While the trend is still bullish, the Semiconductors sector ETF (SMH) has created lower highs since hitting its 261% Fibonacci level in July of this year.
Moreover, it would send a concerning price message if support at (1) would happen to fail. Considering that Semiconductors represent market leadership, all investors should hope support at (1) holds. Stay tuned!
SMH Semiconductors Sector ETF “weekly” Chart

Twitter: @KimbleCharting
The author may have a position in mentioned securities. Any opinions expressed herein are solely those of the author, and do not in any way represent the views or opinions of any other person or entity.


