Investors like a good risk-on stock market environment. And that is often accompanied by technology stocks leadership.
Yesterday we looked at an important bull-bear break line for a key Nasdaq ratio that is testing important support.
Today, we stick with technology but look specifically at the Semiconductors… and a key test of resistance occurring right now.
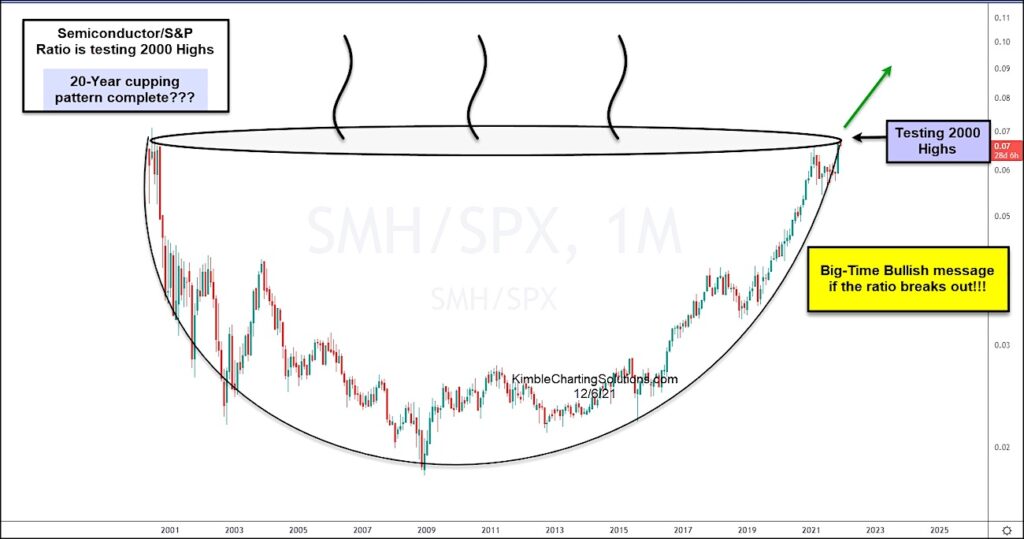
Below is a “monthly” chart of the ratio of Semiconductors to the S&P 500 (broad market). As you can see, the Semiconductors have been a big part of technology leadership over the past decade. And the recent rally has helped for a cupping pattern.
This ratio is now testing its 2000 highs. And a breakout here would be very bullish for the Semiconductors. A breakout here may also keep the Nasdaq out of harms way. This is a big test. Stay tuned!
Semiconductors versus S&P 500 Ratio “monthly” Chart

Note that KimbleCharting is offering a 2 week Free trial to See It Market readers. Just send me an email to services@kimblechartingsolutions.com for details to get set up.
Twitter: @KimbleCharting
Any opinions expressed herein are solely those of the author, and do not in any way represent the views or opinions of any other person or entity.


