Could the S&P 500 continue to advance to 3615 – 3944 before a cyclical bear market? Yes, that’s possible based on historical precedent. To better understand the current secular bull market, it’s a good idea to revisit past ones for size, scope, and quantitative comparison.
Let’s start with the 1950’s secular bull market.
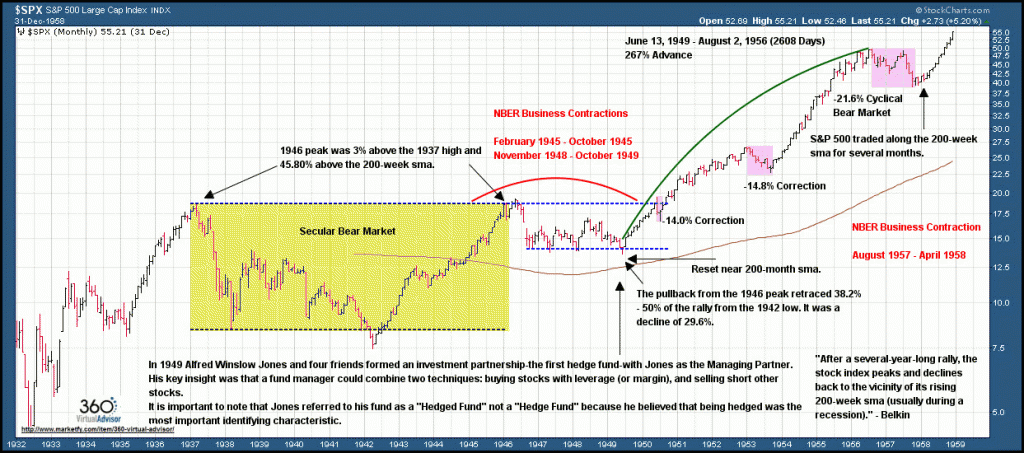
1949 – 1956
- In June 1949 the S&P 500 launched a new secular bull market that rallied 267% over 2608 days before the first cyclical bear market of 1956 – 1957.
- The advance began just above the 200-month sma following a decline of 29.6%.
- Two corrections of 14% and 14.8% during the impulsive leg.
- The 1956-1957 cyclical bear market bottomed along the 200-week sma.
“After a several-year-long rally, the stock index peaks and declines back to the vicinity of its rising 200-week sma sma (usually during recession).” – Belkin
This annotated chart provides more details on the 1950’s secular bull market. Click to enlarge.

charts created on Stockcharts.com
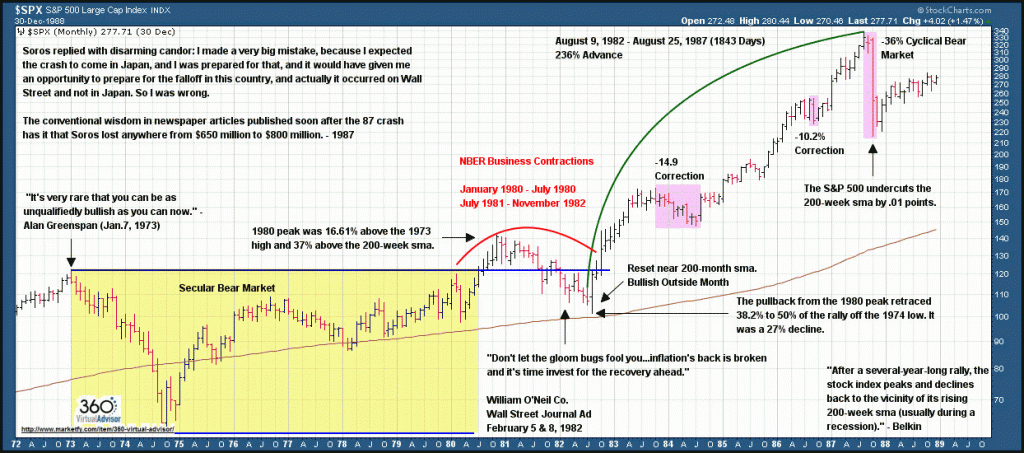
1982 – 1987
- In August 1982 the S&P 500 launched a new secular bull market that rallied 236% over 1843 days before the first cyclical bear market of 1987.
- The advance began just above the 200-month sma following a decline of 27%.
- The beginning of the advance was defined by a bullish outside month.
- Two corrections of 14.9% and 10.2% during the impulsive leg.
- The 1987 cyclical bear market bottomed on the 200-week sma.
The annotated chart provides more details. Click to enlarge.
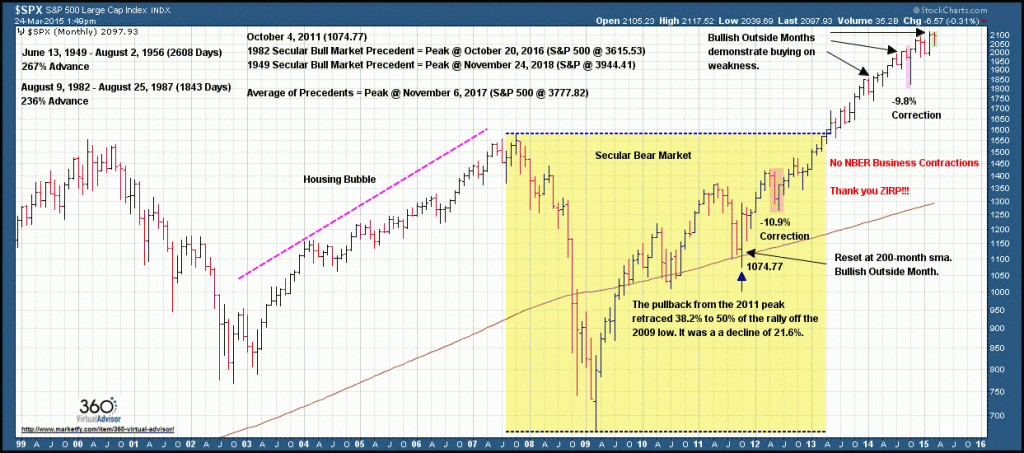
2011 –
- In October 2011 the S&P 500 launched a new secular bull market that has rallied 95% over 1267 days without a cyclical bear market.
- The advance began just below the 200-month sma following a decline of 21.6%.
- The beginning of the advance was defined by a bullish outside month.
- Two corrections of 10.9% and 9.8%.
The annotated chart provides more details. Click to enlarge.
Based on historical precedent it is conceivable that the S&P 500 could rally 72% – 88% from the current price. A cyclical bear market that follows should bottom around the 200-week sma.
- 1982 Secular Bull Market Precedent = Peak @ October 20, 2016 (S&P 500 @ 3615.53)
- 1949 Secular Bull Market Precedent = Peak @ November 24, 2018 (S&P @ 3944.41)
- Average of Precedents = Peak @ November 6, 2017 (S&P 500 @ 3777.82)
Follow Sheldon on Twitter: @hertcapital
No positions in any of the mentioned securities at the time of publication. Any opinions expressed herein are solely those of the author, and do not in any way represent the views or opinions of any other person or entity.


