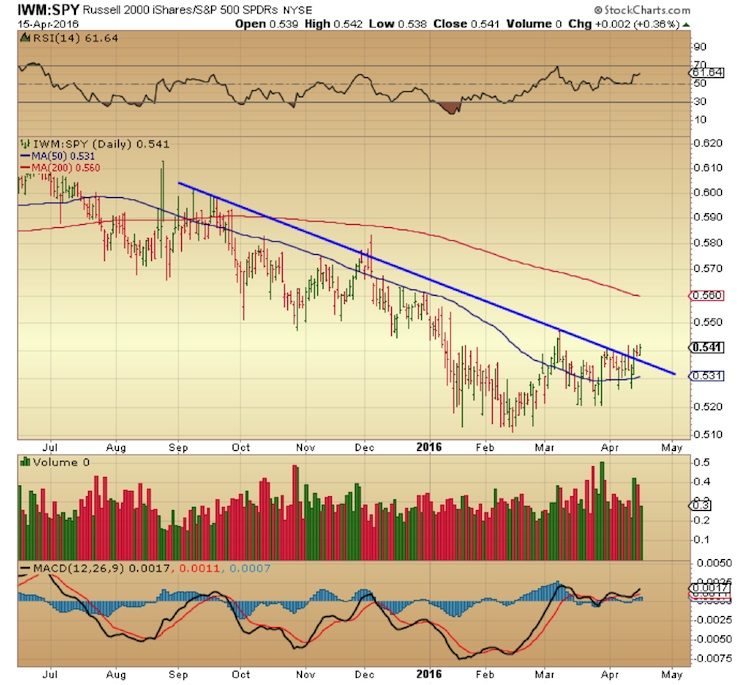
Now let’s take a quick look at the IWM relative to SPY.
This compares small caps stocks (Russell 2000) to large caps stocks (S&P 500).
IWM:SPY Relative Strength Ratio
The most recent wave of underperformance of the Russell 2000 to SPY has been pretty consistent since September 2015 as characterized by the downward sloping trendline on the daily chart above. The igniting bar on Wednesday, however, brought it back above the trendline and managed to hold above it into the end of the week. It will be important to see if it can hold above it this time and continue to outperform or at least keep up with the SPY in the short term. RSI and MACD are bullish here as well.
Keep in mind that financial stocks make up roughly one quarter of the IWM and the rally in financials off earnings from JP Morgan, Bank of America and Wells Fargo last week no doubt gave the Russell a helping hand in its move higher. If strength in the financials were to continue, it would not only bode well for the overall market, but it could be the catalyst that allows the small caps to take this rally one leg higher. Although the IWM has been showing signs of strength as of late, it’s not quite there yet and still has some work to do for it to break out to new levels and confirm its strength.
Multiple stock market indicators seem to point to a clear path higher for markets in the short term. There is a good piece on See It Market from Willie Delwiche from Friday that goes into more detail on breadth and sentiment. If small caps could finally participate in the rally it would be a refreshing and welcome development for market bulls and would give some credence as to the quality of the rally itself.
Twitter: @DDCapitalFund
The author has a position in the mentioned securities at the time of publication. Any opinions expressed herein are solely those of the author, and do not in any way represent the views or opinions of any other person or entity.


