Small cap stocks have been underperforming for most of the past few years.
That said, the small cap Russell 2000 ETF (IWM) has tested and held its 200-day moving average several times since 4th quarter 2023.
Well, another selloff has the Russell 2000 back at that 200-day support.
Today, we let the chart speak for itself.
Note that the following MarketSurge charts are built with Investors Business Daily’s product suite.
I am an Investors Business Daily (IBD) partner and promote the use of their products. The entire platform offers a good mix of tools, education, and technical and fundamental data.
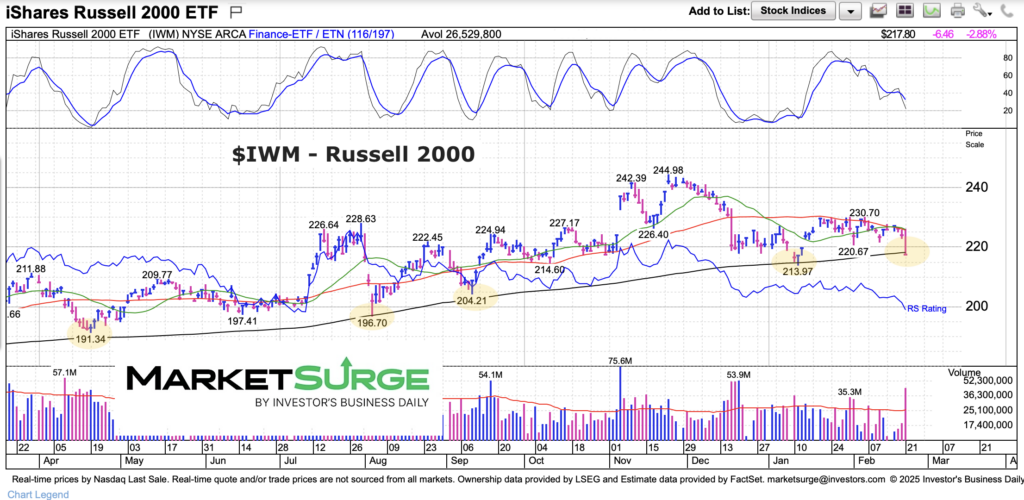
$IWM Russell 2000 ETF Chart
As you can see, this is the 5th time the Russell 2000 has tested its 200-day moving average. Might be important that it holds (for further reference, look at the “weekly” chart). Stay tuned.
Twitter: @andrewnyquist
The author may have a position in mentioned securities at the time of publication. Any opinions expressed herein are solely those of the author, and do not in any way represent the views or opinions of any other person or entity.


?")
 Underperforming Major Stock Indices")

