The stock market rally off the March 23 coronavirus lows has been lead by large cap tech stocks.
Or, we could re-phrase that and say what it HAS NOT been lead by.
Today, we look at that angle with some investing insights. Again, just a brief article with some takeaways for active investors.
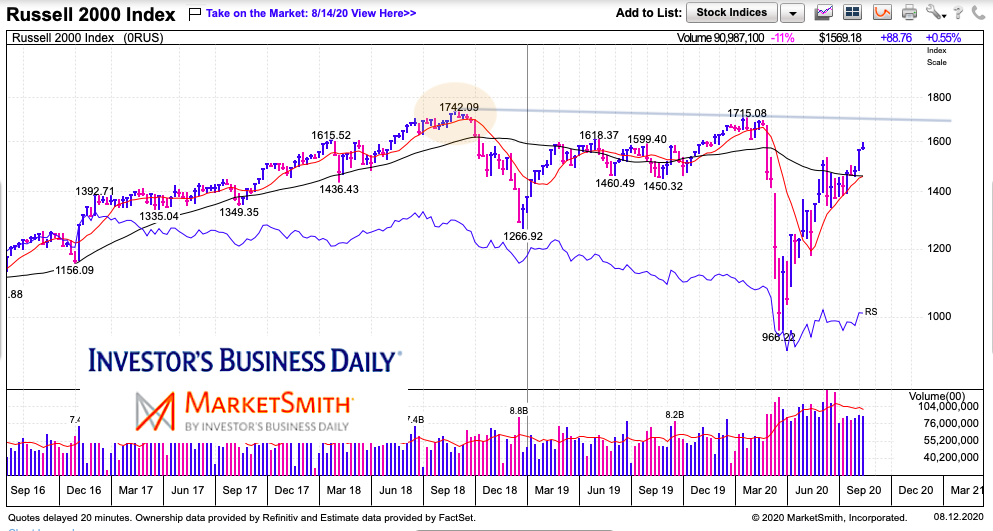
Today, we look at the Russell 2000 Index (small cap stocks). The index has been a major laggard but has played “catch up” in recent days/weeks. Let’s analyze how that happens…
Note that the following MarketSmith charts are built with Investors Business Daily’s product suite.
I am an Investors Business Daily (IBD) partner and promote the use of their products. The entire platform offers a good mix of technical and fundamental data and education.
Russell 2000 Index “weekly” Chart
Catch up plays occur after a couple of pullbacks in a strong up-trend off the lows. Basically, it’s when the market leaders have forged ahead with 2 or 3 strong waves higher, and as the market begins to get tired, market leaders stall and investors find beta in catch up plays (laggards). In this case it’s the Russell 2000.
BUT, the word word of caution is that the catch up plays (rotation out of a bear market) tend to need more time to develop… which is why they lagged in the first place. And their rally toward all-time highs is highly likely to fail at first pass.
So, here we have the Russell 2000. I’m not bearish here… but I’m definitely NOT bullish here. My analysis points to a Russell 2000 peak in the coming days/weeks (like a secondary peak where laggards lead) and a legitimate correction to follow. Careful here. This should drag the major indices lower as well. Just my two cents.

Twitter: @andrewnyquist
The author may have a position in mentioned securities at the time of publication. Any opinions expressed herein are solely those of the author, and do not in any way represent the views or opinions of any other person or entity.


