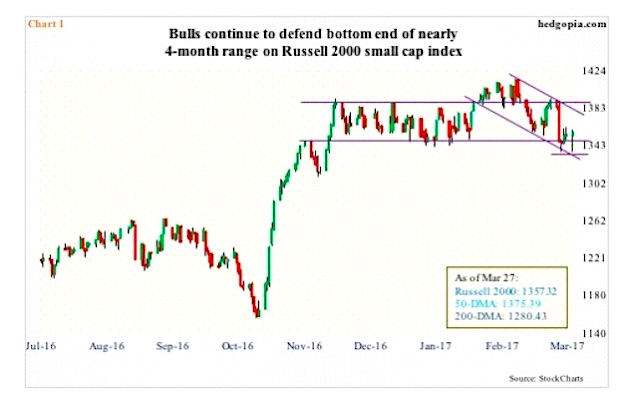
Determined not to let go of nearly four-month support, small-cap bulls once again stepped up to the plate Monday – sending the Russell 2000 Index (INDEXRUSSELL:RUT) higher.
From down 1.4 percent intraday to close the session up 0.2 percent, the Russell 2000 small cap index initially got pushed under the 1347-1392 range but managed to crawl its way back up, in the end producing a hammer session. This was preceded by a long-legged doji last Friday (see chart 1 below).
At least near term, small-cap bulls may have wrestled the ball from the bears.
Monday’s session also saw other major U.S. stock market indices such as the S&P 500 large cap index (INDEXSP:.INX), Dow Jones Industrials and the Nasdaq Composite all defend their respective 50-day moving averages.
For the S&P 500, this was the first test of that average post-November 8 election. The Dow Jones also came close to testing it early February, while for the Nasdaq it was the first test since last December.
The Russell 2000, however, began testing the average in the middle of January, lost it early this month, and most convincingly on the 21st. The 50-day is now flat to slightly down. This is where it gets tricky. Will the bulls be able to recapture the average or will the bears get aggressive when it gets tested?
For now, bulls are putting money where their mouth is.
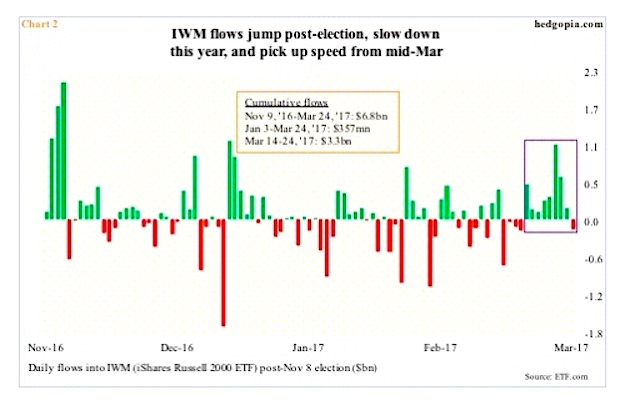
In the nine sessions through last Friday, the iShares Russell 2000 ETF (NYSEARCA:IWM), attracted $3.3 billion (violet box in chart 2 below). This compares with a mere $357 million year-to-date. Post-election, flows surged – $6.8 billion in total – but the pace substantially decelerated this year. Hence the significance of the resurgence from the middle of this month.
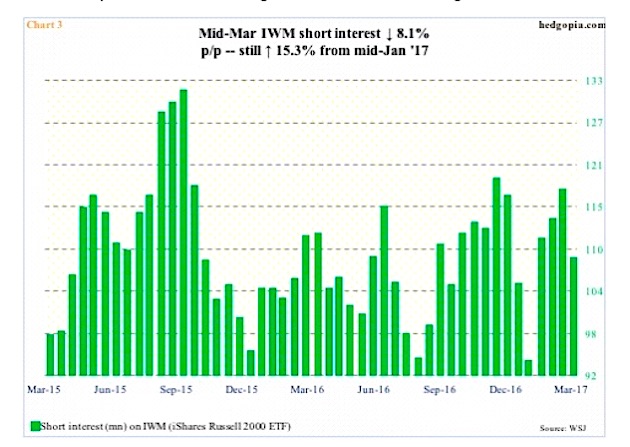
If this pace continues, short interest can help.
By the middle of March, IWM short interest stood at 108.1 million shares, down 8.1 percent from the prior period, but remains elevated versus two months ago. After the Russell 2000 began to go sideways, mid-January, shorts decided to press, when short interest jumped 18.3 percent p/p. It is possible some kind of squeeze took place yesterday, and in the right circumstances there is room for more.
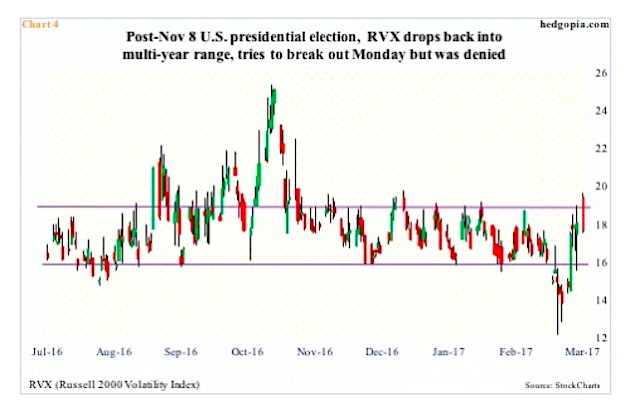
Particularly considering how volatility is faring at the moment.
The Russell 2000 volatility index (INDEXCBOE:RVX), remains range-bound. Bears’ attempt on Monday to convincingly take out the 200-day moving average was repelled hard. On the weekly basis, there is plenty of room for volatility to continue higher, but the daily chart looks to be itching to move lower. The reaction yesterday probably gives small-cap longs the reason to sell volatility near term.
In this scenario, the Russell 2000 (1357.32) has room to go test resistance. And there is a ton – 1375 (50-day moving average), 1380-ish (declining trend line from March 1 record high), and, of course, 1392. What happens here will be pivotal. While this offers an opportunity for bears to get aggressive, 1Q17 earnings season is about to get underway, and, as is customary pre-earnings, estimates have been revised lower. Time will tell if this tailwind is enough to head off technical headwind.
Thanks for reading!
Get more research and ideas from my website hedgopia.
Twitter: @hedgopia
Author may hold a position in mentioned securities at the time of publication. Any opinions expressed herein are solely those of the author, and do not in any way represent the views or opinions of any other person or entity.


