The Russell 2000 Index appears stalled beneath its summer 2024 high in a way that’s similar to what we described a few weeks ago for the NASDAQ 100 ETF.
In this article, we examine a possible downward Elliott wave path if this stallout becomes a reversal lower. And at the end, we also provide a brief update on the status of our other recent Elliott wave forecasts.
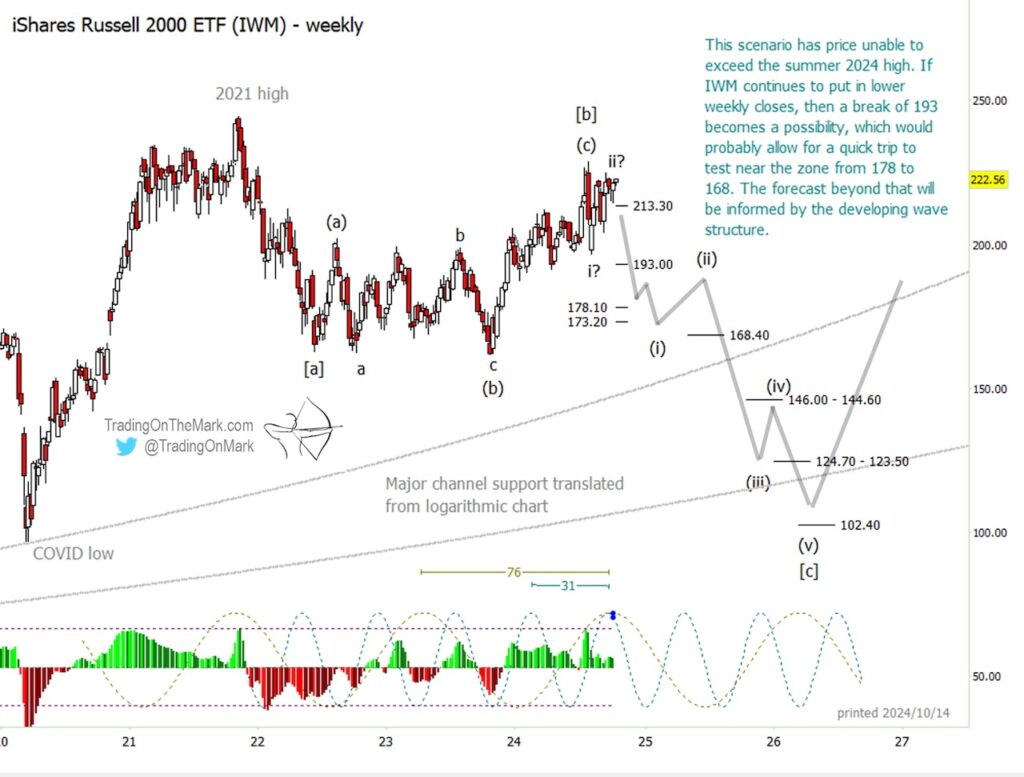
Using the iShares Russell 2000 ETF (NYSEARCA:IWM) to stand in for the index, the weekly chart shows how IWM might be in worse shape than QQQ. Both funds have been unable to retest their summer highs, but IWM also has stayed beneath the 2021 peak that QQQ exceeded almost a year ago. This is a warning sign for those who believe the market valuation of mid-cap companies is more predictive than the large-cap indices.
As with the NASDAQ, we think price action on the Russell 2000 ETF (IWM) since the 2021 high has taken the path of a corrective structure that is not yet complete.
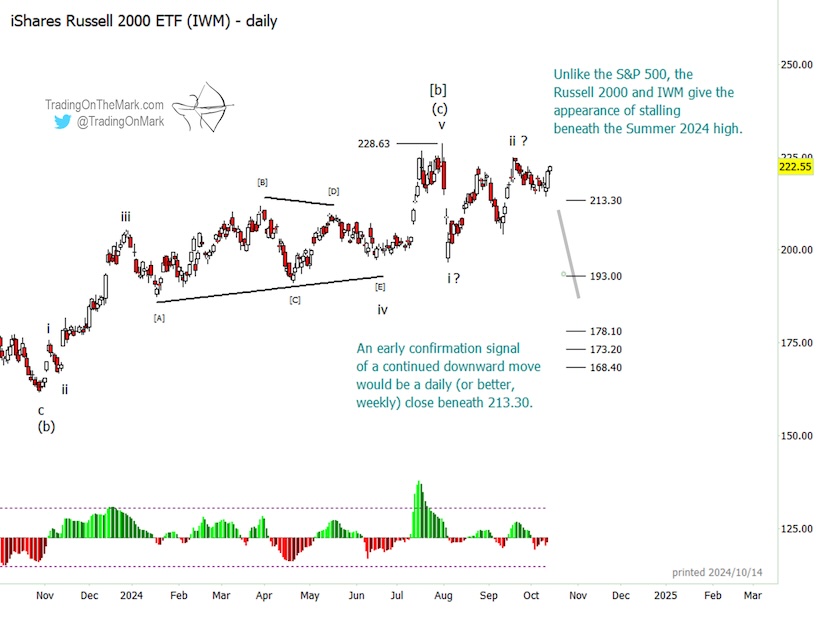
At some point the structure would require a downward change of trend to complete the pattern. Right now it appears that the trend change might already have begun, although we still need to see more confirmatory signs.
The price area near 213.30 appears to be important support, and a weekly close beneath that level would be an early confirming signal for the bearish scenario. On a time frame faster than weekly, the level might even present the opportunity of seeing price fall through and then rise again to test the level from below.
Conversely, this specific bearish scenario would be invalidated if price were to reach above the summer high of 228.63, although there are other bearish scenarios that could still come into play after an upward break.
If downward momentum increases, and if the downward price action continues to look impulsive, then the next important support waits near 193.00. A break of that would allow for a test of the zone from 178.10 to 168.40, with 173.20 as a likely support area in the middle of that zone. We have sketched out a speculative downward path among the support levels shown on the weekly chart.
Two other support structures are shown on the weekly chart as upward-curving lines. Those represent potential big-picture channel support that’s visible on a logarithmic chart (not shown here). One or both of the curves could come into play as price finds its way downward. It will be interesting to see whether those structures intersect with price near the numerical support levels that are also shown on the chart.
We note that two of the strongest cycles in the IWM market are peaking this month, which is another point in favor of expecting a downward turn. They have periods of 76 weeks and 31 weeks.
Updates on recent posts:
The treasury bond ETF has fallen beneath expected support levels, but the bullish count shown on our TLT charts is still valid as long as price doesn’t make a daily close beneath 92.00. Despite the current depth of the retracement, the corrective pattern does not yet not appear complete. The decline since September 18 looks to us as merely the first segment of a corrective structure that could ultimately take either a three-wave or five-wave form. After the correction, our scenario still has price resuming its climb.
The Euro ETF is following the plan we outlined three weeks ago. A break of the nearby support at 102.80 prompted a fast trip to the next support zone at 100.60, with more bearish action expected.
The Japanese Yen ETF has fallen in a manner consistent with the retrace we were expecting. The main scenario we described was bullish with the expectation that price should make a higher low during the next few months. However we would caution that there is another plausible scenario that would require one more lower low before the upward reversal could kick in. Any traders watching for a bounce should monitor the downward wave structure on weekly or daily time frames to note whether it continues to look corrective (which predicts a higher low) or begins to look impulsive downward (which would lead to a new lower low).
Elliott wave analysis identifies the places where the market is more likely to turn, as well as the possible target destination of a move. It also shows where price specifically should not go if the main scenario’s thesis is true. For a trader to make use of these “if this, then that” types of scenarios, it’s helpful to have guidance from people who have already integrated Elliott wave into their trading. Our newsletter follows the major stock indices, currencies, metals, bonds, and related markets on weekly and daily time frames. You can also inquire about our intraday service, which is more customized.
Twitter: @TradingOnMark
The authors may have a position in the mentioned securities at the time of publication. Any opinions expressed herein are solely those of the author, and do not in any way represent the views or opinions of any other person or entity.


