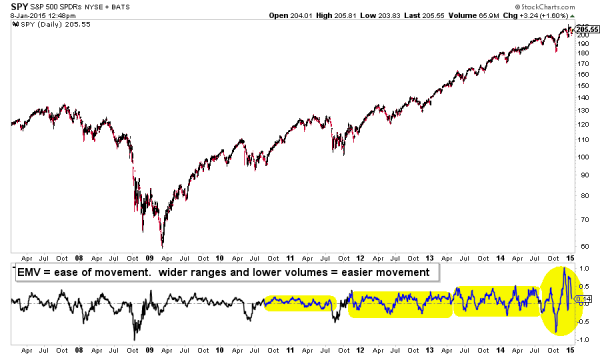
Over the past few months we’ve seen some unprecedented action as stocks continue to rip higher with ease, blowing off the downdrafts. Yet at the same time, there is instability across the currency, commodity, and bond markets. As well, it appears that there are some credit market issues beneath the surface.
As troubled nations and businesses continue to hide their problems as long as they possibly can, it hints that we may be stuck in this environment for awhile. But money keeps finding a home in stocks…
SPDR S&P 500 ETF (SPY) – Daily Chart
That said, the market rotation story is in tact with several of the same market themes developing. Defensive, bond-like groups continue to show leadership and biotechs are still the leading group. The biggest changes that I can see are the emergence of the home-building group and precious metal sector. Let’s take a look at the charts.
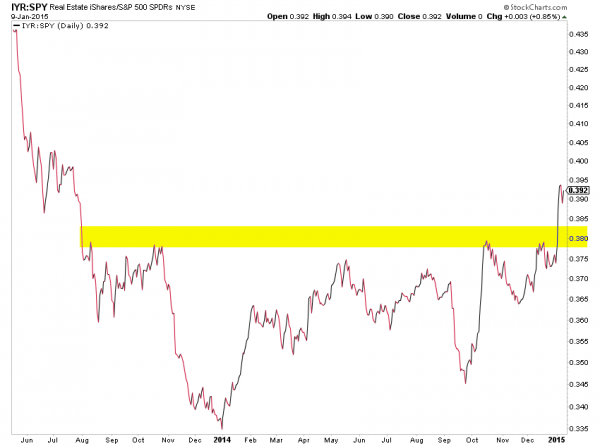
Last week I mentioned this potential breakout in REIT relative strength. There’s no doubting this breakout in the Real Estate iShares ETF (IYR)!
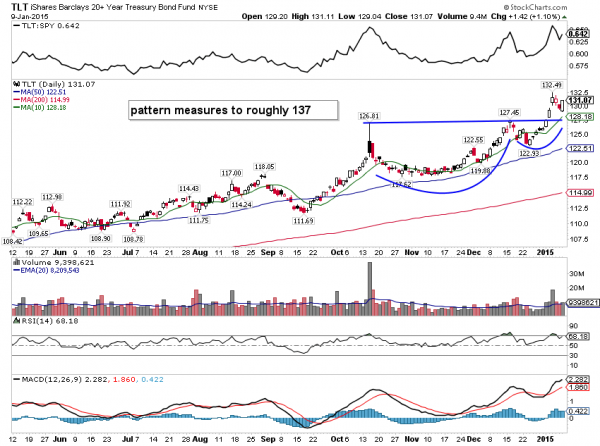
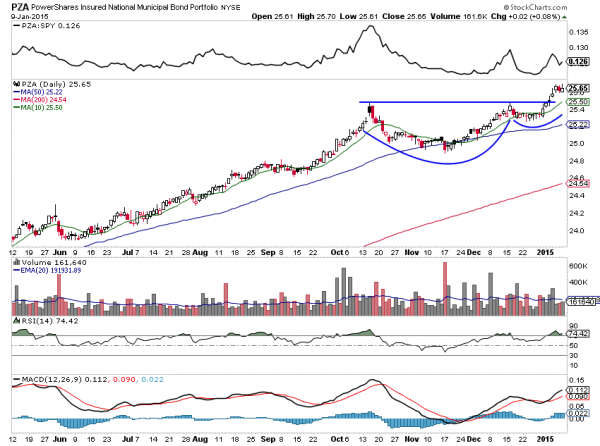
The yield chase is on in a big way as long bonds, iShares 20+ year Treasury Bonds (TLT), and muni bonds, PowerShares Insured National Muni Bonds (PZA) have broken out of cup with handle pattern bases.
TLT Daily Chart
PZA Daily Chart
Gold (GLD) and the precious metals sector are really starting to shape up and trade with some relative strength. This leads me to think the US Dollar could be nearing a reversal. I shared some thoughts on gold recently here on See It Market.
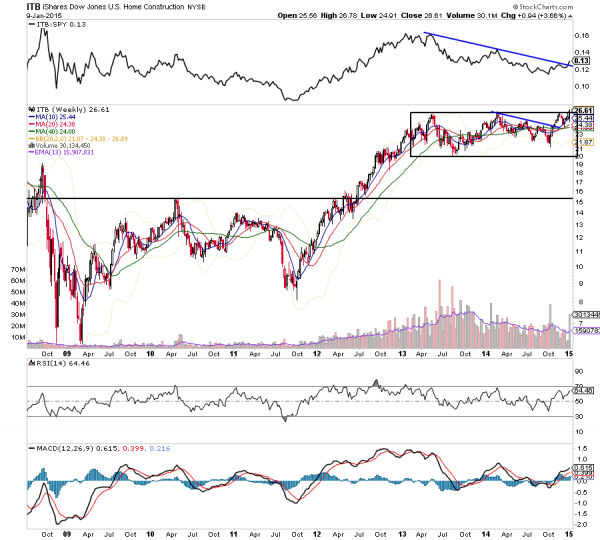
Just when you think the homebuilders / construction sector is dead, they bust loose. Check out this relative strength breakout in the iShares Dow Jones U.S. Home Construction ETF (ITB).
ITB Daily Stock Chart
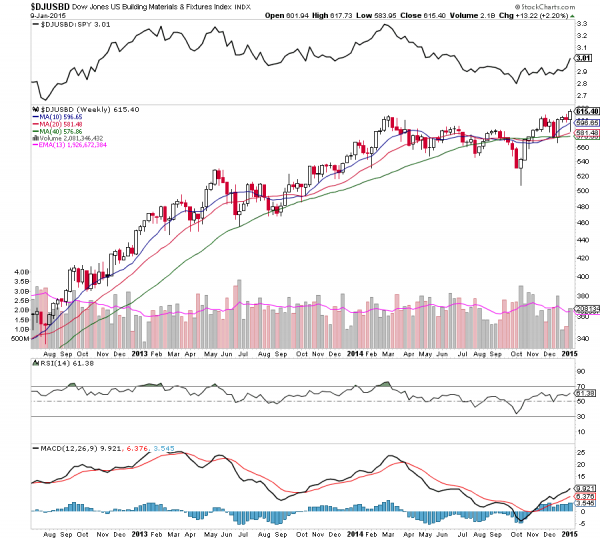
We’re seeing the same action in the Building Materials. There are some very nice bottoming bases building in the home-building space – check out tickers like TOL, USG, MHO, OC, and CSTE. Even if you’re extremely bearish, I don’t know how you can avoid some sort of exposure to this group if we continue to see upside from these levels.
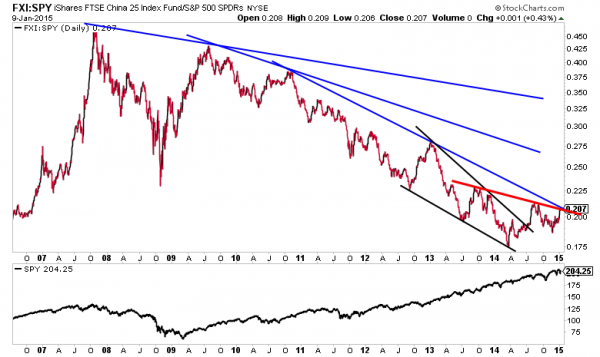
Lastly, let’s venture overseas and put a spotlight on another developing market theme: China. Namely the iShares China ETF (FXI). It’s been showing some relative strength vs SPY of late. This is definitely something to watch moving forward. See the relative strength chart below.
Thanks for reading. You can read more of my work over on my blog: At the Money Charts.
Follow Aaron on Twitter: @ATMcharts
Author carries exposure to several mentioned securities at the time of publication. Any opinions expressed herein are solely those of the author, and do not in any way represent the views or opinions of any other person or entity.

