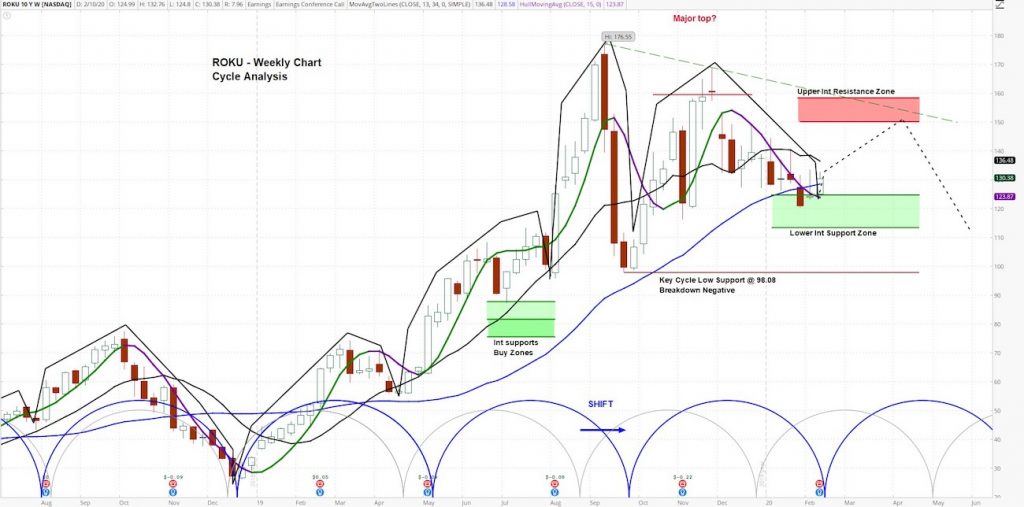
Roku (ROKU) Weekly Chart Grid
Please note: ROKU reports earnings after-hours on 2/13/2020.
$ROKU – askSlim Technical Briefing
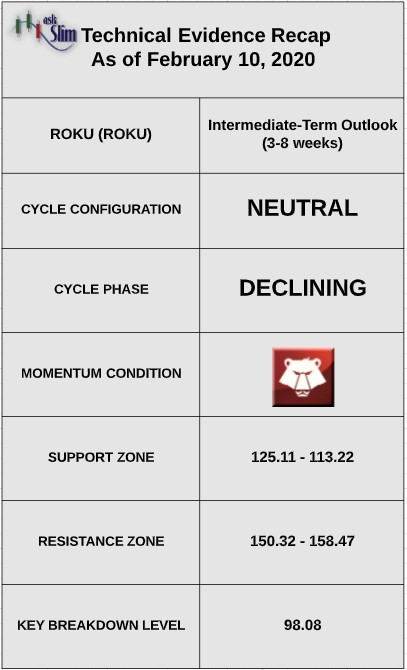
The weekly cycle analysis suggests that the stock is in a declining phase and due to form an intermediate-term low in the month of February. Weekly momentum is negative.
On the upside, there is an intermediate-term resistance zone from 150.32 – 158.47. On the downside, there is an intermediate-term support zone from 125.11 – 113.22.
For the bears to regain control of the intermediate-term, we would likely need to see a weekly close below 98.08.
$ROKU – askSlim Sum of the Evidence
ROKU is due to form an intermediate-term low. The longer-term cycle configuration in the stock is neutral.
Given this analysis, there is a likelihood that the stock will test the intermediate-term resistance zone beginning at 150.32 by May of this year.
Interested in askSlim?
Get professional grade technical analysis, trader education and trade planning tools at askSlim.com. Write to matt@askslim.com and mention See It Market in your email for special askSlim membership trial offers!
Twitter: @askslim
Any opinions expressed herein are solely those of the author, and do not in any way represent the views or opinions of any other person or entity.


 Nearing A Bottom?")

 Nearing A Bottom?")

