Written last week, “Retail XRT continues to have my attention. I will follow her. Over 80 I am all in on a bull run in equities. Under 70, I am cautious, if not bearish, in equities.”
I wrote this before I put in the channel lines, a channel I must say that is a technical trader’s dream!
First, what is a channel?
You know what is incredible?
Here is an article I wrote in 2010 about the channel in Semiconductors SMH, another key member of the Economic Modern Family.
“What is a price channel? A price channel is a continuation pattern that slopes up or down and is bound by an upper and lower trend line. The upper trend line marks resistance and the lower trend line marks support.”
In that article I write about the slope of the channel lines, either bullish or bearish. But in today’s chart of the Retail Sector (XRT), the lines are parallel.
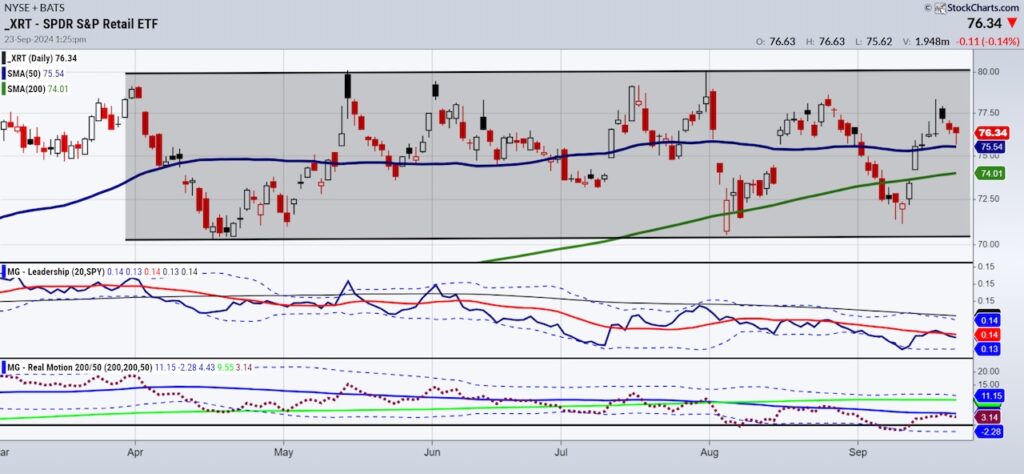
Currently, XRT is in the middle of this high and wide channel. Analyzing the moving averages and phases is powerful but one can see that if the chart pattern is overlaid, XRT is now trading within the middle of the channel.
So, one would think that if the price breaks the channel either to the up or downside, the move would be powerful.
But the reverse is true. The wider the channel, the less velocity the break up or down is.
What should we look for now?
Best case scenario-a consolidation at either the low or high end of the channel. Then buy or sell the breakout or breakdown of that consolidation.
In other words, we want tighter compression within the channel, closer to its bottom or top.
What else is this chart telling us?
The phase remains bullish as today, XRT touched down on the 50-daily moving average and held.
The Leadership chart shows XRT underperforming SPY. That of course, supports the fact that XRT is in the middle of the channel range.
The Real Motion indicator also tells us that jumping the gun to buy XRT before we know which way the channel reconciles, is indeed premature.
Momentum is in a bearish divergence as the red dots are beneath both the 50 and 200-DMAs while the price is above.
Hence, some patience is required.
However, the patient will be handsomely rewarded, as retail is huge and very necessary to keep the SPY and Dow on new all-time highs.
Twitter: @marketminute
The author may have a position in mentioned securities at the time of publication. Any opinions expressed herein are solely those of the author and do not represent the views or opinions of any other person or entity.
: Creating Bullish Divergence?")


 and Semiconductors (SMH): Concerning Price Pattern?")


