Red Hat (RHT) traded 5% higher on Tuesday morning after exceeding Wall Street estimates.
The open-source software company reported earnings per share of $0.91 and total revenue of $772 million, compared to analyst expectations of $0.81 and $762 million. Earnings were 49% higher and revenue 23% higher compared to one year ago.
In explaining their performance, CEO Tim Whitehurst cited “strong subscription revenue growth,” speaking to investors and analysts on the earnings call.
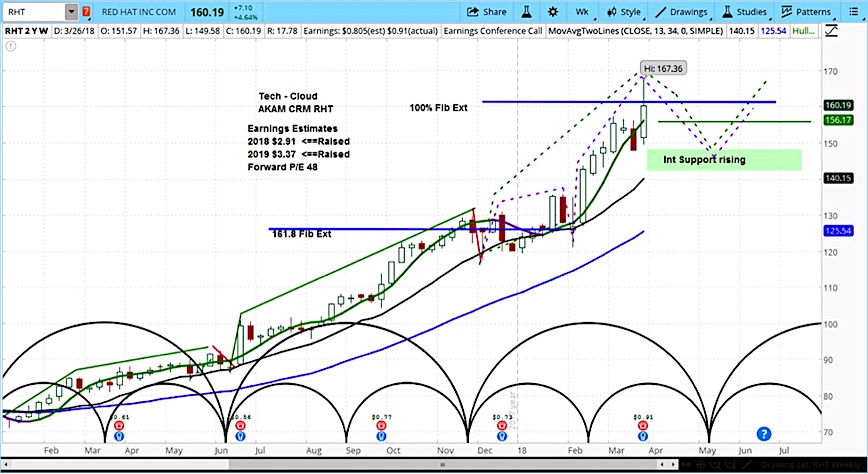
Looking at the weekly chart below, it is clear that RHT has been in a powerful upside move, hitting the 100% Fibonacci extension. With its current market cycle ending it May, there could be an opportunity to buy at better prices.
Our target is a pull back to $148.
(see $RHT stock chart below)
Red Hat (RHT) Stock Chart with Weekly Bars
For an introduction to cycle analysis, check out a clip of our Big Picture Analysis, or visit askSlim.com and become a free Level 1 member for the full version.
Twitter: @askslim
Any opinions expressed herein are solely those of the author, and do not in any way represent the views or opinions of any other person or entity.


