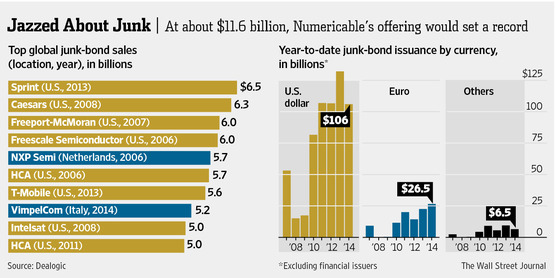
 Vague whispers of monetary tightening notwithstanding, yesterday gave a staggering reminder that the developed world remains awash in cheap money with Numericable SA’s announcement of what promises to be “the largest junk-bond sale in history”. The French cable company’s offering today is projected to raise €8.4 billion ($11.6 billion), dwarfing the (comparatively paltry) post-crisis and all-time record set last year by Sprint at $6.5 Billion.
Numericable’s deal (increased 40% in the last week) comes 5.5 years into a mostly static ZIRP policy environment in the US and Europe that has fostered an ever-more-insatiable appetite for yield. And, as the story goes, onerous (by recent standards, anyway) bank capitalization requirements continue to constrain lending to a degree prompting mass exodus to debt markets where companies of less-than-exemplary standing with rating agencies can find cheap capital in abundance. Borrowing costs remain so low the year-to-date run rate for issuance of speculative-grade paper is at a record high, with four of the top ten junk-bond sales occurring in the last year:

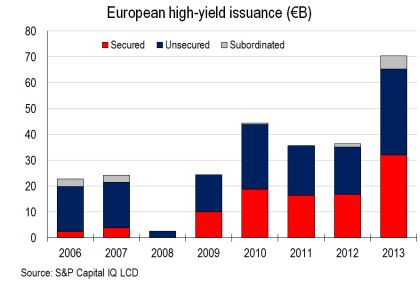
And though US junk bond issuance actually decreased year-over-year in 2013 (-6% to $259.5B from 2012’s record $274.8B), as the chart above hints European offerings destroyed 2010’s peak last year and are already just negligibly off surpassing 2013’s record with 8 months remaining.
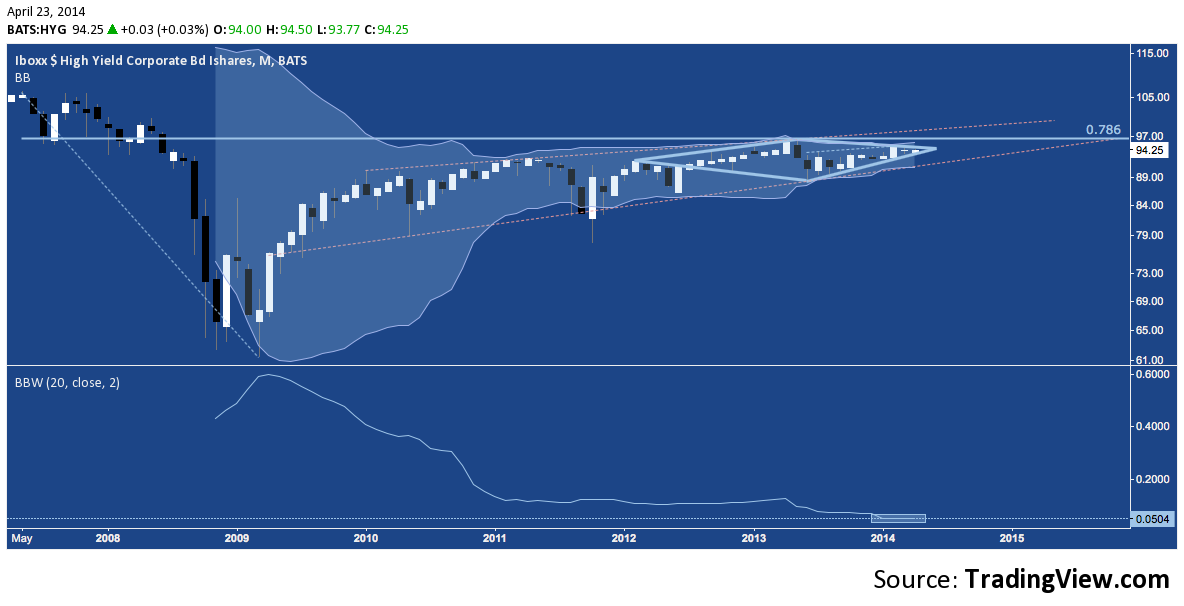
In the US, High Yield continues to hover near record low yields:
Cautionary words about the current iteration of the cheap debt carousel ride are few as most analysts extol strong backward-looking fundamentals to extrapolate ever-increasing market size and the ravenous, ineluctable demand that will goad it ever forward. In quiet contrast, astute observers continue to sound the warning bell: as Jeff Gundlach put it last month: “They’ve squeezed all the toothpaste out of the tube…there is interest-rate risk that’s just being masked by fund flows holding up the prices of junk bonds.”
That’s an apt description of the cyclical market dynamics behind the monthly chart of High Yield Bond ETF HYG. Nearing the apex of a 2-year diamond top (and 1-year rising wedge inside), HYG is just below the 2007-2009 78.6% fibonacci retracement in the context of a 5-year bearish rising wedge. Though it may take awhile to play out, with volatility compressed to a historic low, the technical backdrop for high yield suggests a resurgence of risk is coming; and it’s overwhelmingly skewed to the downside.
Twitter: @andrewunknown and @seeitmarket
Author holds no position in securities mentioned at the time of publication. Commentary provided is for educational purposes only and in no way constitutes trading or investment advice.
Any opinions expressed herein are solely those of the author, and do not in any way represent the views or opinions of any other person or entity.


