I like ratio analysis. It shows rotation, strength vs weakness, and a bunch of insights into market behavior.
Greece and the Eurozone have been all the rage this summer and, well, rightly so – I guess.
But I’m trying to tune all that noise out and just draw some charts that provide insights into price patterns and behavior.
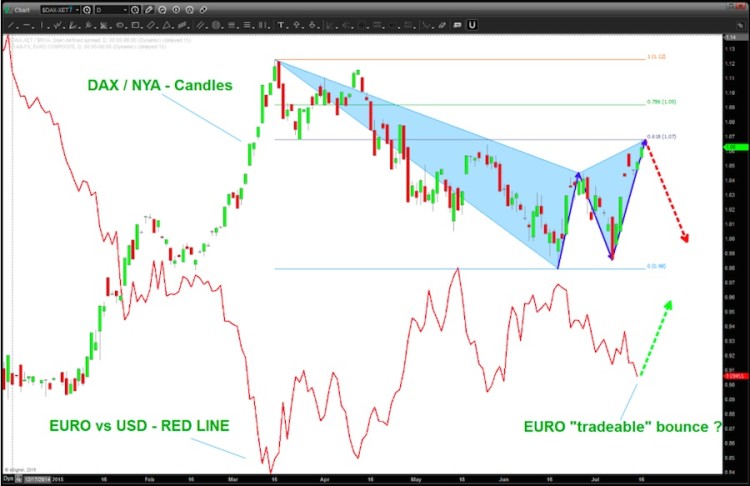
Here’s the deal. When the German DAX underperforms the NYSE Composite (the candles go down) then the Euro (EURUSD) bottoms and goes UP against the dollar (red line).
In the chart below, I used ratio analysis on the German DAX vs NYSE Composite Index to show how we may have just finished a sell pattern. If so, the DAX should begin to underperform now. And, if 2015 is any guide, then the Euro should bottom and start up for a tradeable long.
Thanks for reading and have a great weekend.
Twitter: @BartsCharts
Read more of Bart’s work on Bart’s Charts.
Author does not have a position in mentioned securities at the time of publication. Any opinions expressed herein are solely those of the author, and do not in any way represent the views or opinions of any other person or entity.


