Wednesday, the market rallied into the Feds rate announcement, showing speculator’s optimism given the current downward trend.
It also helped that Monday, the Nasdaq 100 (QQQ) held key support at $318 sparking a rally on Tuesday.
Now, with a rate increase of 0.25% the market continues to push higher off Monday’s low.
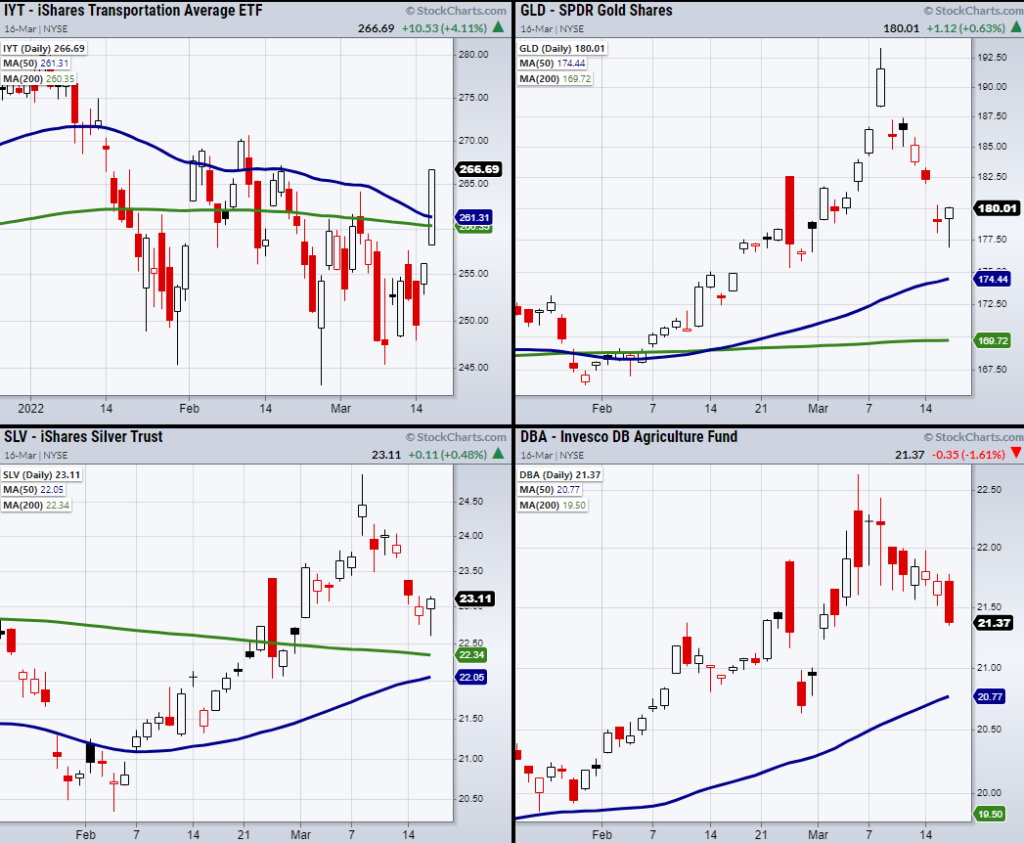
Additionally, with the market standing its ground for the moment, the transportation sector has pierced two of its major moving averages.
The above chart shows the transportation ETF (IYT) closing over both its 50-day moving average (blue line) and the 200-day moving average (green line).
Because the movement of goods is an extremely important factor within the economy, if IYT continues to hold over the $260 area this could help the market hold its current price area.
However, can IYT change the major indices’ downward trend is another story since this rally takes them back into a resistance area.
Having said that, Wednesday’s positive close is still met with the reality of rising inflation and costs across the board.
That is why we are continuing to watch the market from a stagflation/rangebound standpoint.
Overall, inflation has kept our eyes on commodities such as Gold (GLD), Silver (SLV), and food ETFs such as Invesco Agricultural Fund ETF (DBA).
While the equities market can enjoy brief runs in price it is still a tough area to trade as the market has yet to show it can change its overall trend to the upside.
Stock Market ETFs Trading Analysis and Summary:
S&P 500 (SPY) 410-415 is price support. 441 is price resistance.
Russell 2000 (IWM) 188-193 is price support. 203 is the 50-day moving average to clear.
Dow Jones Industrials (DIA) 322-326 is price support. 342 is price resistance.
Nasdaq (QQQ) 318 is price support. 350 to is price resistance to clear.
KRE (Regional Banks) 73.21 is the 50-day moving average to clear.
SMH (Semiconductors) Needs to hold over Wednesday’s low at 250.
IYT (Transportation) Needs to hold over 260.
IBB (Biotechnology) 118 is price support. 129.95 50-day moving average to clear next.
XRT (Retail) 78 is price resistance. 75 is support to hold.
Twitter: @marketminute
The author may have a position in mentioned securities at the time of publication. Any opinions expressed herein are solely those of the author and do not represent the views or opinions of any other person or entity.


