 By Andrew Nyquist
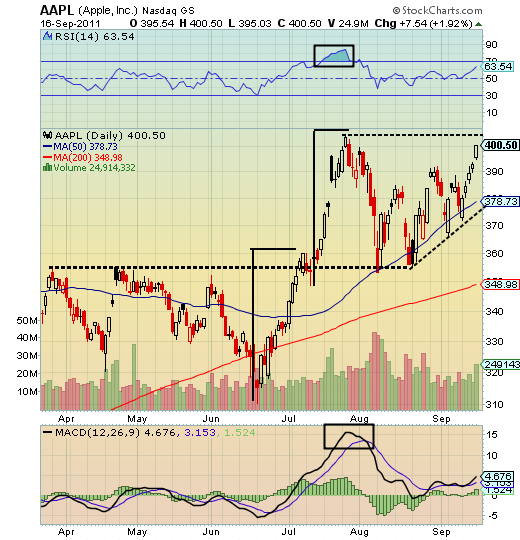
Apple, Inc. (AAPL) closed at 400 on Friday and is nearing its recent highs around 405. This is quite a feat, considering the depth of the market correction as well as the late August announcement that Steve Jobs is stepping down as CEO.
Although AAPL stock looks buyable on pullbacks, it’s good to know your technical levels and setups. For instance, where is support/resistance? The 50 day moving average (dma)? Current Trendline? Asking and answering these questions assists investors in identifying risk-reward scenarios.
Looking at the AAPL stock chart, it’s probably wise to wait for one of the following (or better yet, both – and in this order): 1) Retest the 50 dma / rising trendline 2) break to new highs and successfully retest the breakout (405ish). Bottom line is that it is probably best to wait for resolution of a breakout or breakdown.
Author’s note: #2 it is, confirmed by 9/19 market close above 410. 400-405 area now support. If long or initiating a position, stops can be set in 400-405 area depending on risk profile.
—————————————————————-
Your comments and emails are welcome. Readers can contact me directly at andrew@seeitmarket.com or follow me on Twitter on @andrewnyquist. Thank you.
No positions in any of the securities mentioned at time of publication.
Any opinions expressed herein are solely those of the author, and do not in any way represent the views or opinions of his employer or any other person or entity.


