 By Andrew Nyquist
There are many different technical patterns that can and do form in stocks and market indices throughout the course of time. Some are more common than others and some are easier to spot than others, depending on experience and technical analysis skills. From a head and shoulders, to a double top or double bottom, to a wedge or blowoff top… the list goes on and on. It’s technical analysis 101. But today I want to highlight an obvious emerging pattern in the S&P 500. And how this pattern resolves will dictate short term stock market performance.
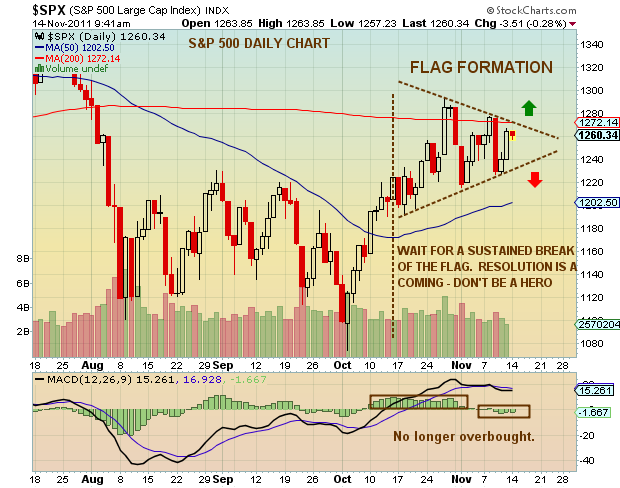
The formation that I am speaking to is the pennant pattern. Just like it sounds, the pennant pattern forms during a period of consolidation following a large move upward over a short period of time. Often times they continue with the current trend, and in this case that would mean that this could be bullish, as the market is up quite a bit over the past month and a half. However, I caution you that the markets are tense and the best thing to do if you are a trader is to wait for resolution.
Better said, wait for the pattern to break and sustain for a day or two one way or the other. Looking at the chart below, volume has fallen and the pennant has begun to narrow. This indicates that a move is forthcoming. The market is no longer overbought, indicating that a big move either way could be in the offing.
Happy investing.
———————————————————
Your comments and emails are welcome. Readers can contact me directly at andrew@seeitmarket.com or follow me on Twitter on @andrewnyquist. For current news and updates, be sure to “Like” See It Market on Facebook. Thank you.
No positions in any of the securities mentioned at time of publication.
Any opinions expressed herein are solely those of the author, and do not in any way represent the views or opinions of his employer or any other person or entity.


