 By Andrew Nyquist
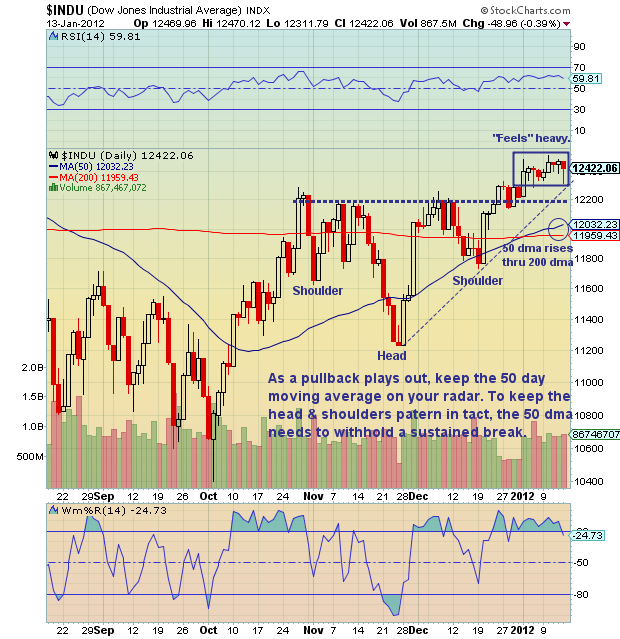
Although the Dow Jones Industrials Average (DJIA) is looking a bit heavy of late and a pullback is probably coming sooner than later, it does have some positives going for it. The 50 day moving average (dma) rose through the 200 day moving average (Golden Cross) — many look at this as a bullish development, especially over the mid-term (6-12 months). The last time this occurred was October 2010 and the market continued to move higher for some time before topping out in May of this year.
So, what should bullish investors look for if the Dow Jones sells off. Well, if it is going to be a healthy pullback, it should be able to hold the 50 day moving average (currently at 12,030). A “sustained” break would be bearish and imply that something was amiss — Note that I define a sustained break as 3 closes below (or above) a certain level of support or resistance.
Near term support levels: The Industrials held the first level of support (the rising trendline). If this breaks, the next support level is around 12,200 (the head and shoulders neckline). Then the 50 dma… Watch the levels closely and let them guide your conviction.
**Other technical stock charts found here.
Tagged and searchable under “chartology.”
Dow Jones Industrial Average (DJI or DJIA) annotated daily stock chart with technical analysis overlay as of January 13, 2012. Price Support and Resistance Levels with Trendlines. DJI or DJIA
———————————————————
Your comments and emails are welcome. Readers can contact me directly at andrew@seeitmarket.com or follow me on Twitter on @andrewnyquist or @seeitmarket. For current news and updates, be sure to “Like” See It Market on Facebook. Thank you.
No positions in any of the securities mentioned at time of publication.
Any opinions expressed herein are solely those of the author, and do not in any way represent the views or opinions of his employer or any other person or entity.


