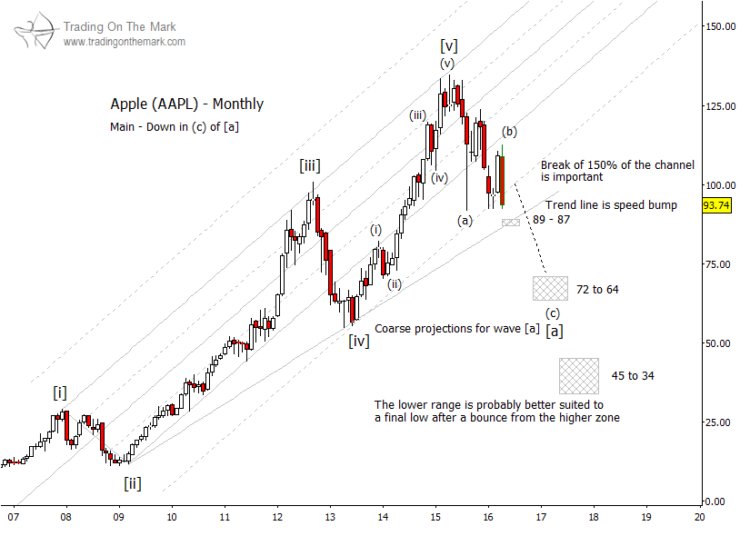
The pending decline in shares of Apple Inc. (AAPL) could be almost as impressive as its meteoric rise from 2009. While the stock far outpaced the NASDAQ during its six-year recovery rally, it also has showed clearer signs of a trend change during the past year.In this post, we look at an AAPL elliott wave pattern to show some of the downward price targets to watch, as well as some of the events that would help confirm our forecast for lower.
One of those confirming events occurred just recently when AAPL fell from the resistance area we had been watching in early April.
From an AAPL Elliott wave chart perspective, a forward projection requires an understanding of the pattern that preceded it. In the case of AAPL, the stock has traced an almost textbook-perfect impulsive pattern up from its value in the 1990s. However in recent months it has challenged geometric support from the channel that has guided its rise since the 2009 crash.
This bearish development suggests that it is time to view the lengthy impulsive wave from the 1990s as possibly complete. In that view, the next phase of the AAPL elliott wave pattern should be a downward corrective one.
Although there are several forms an AAPL correction could take, it should be similar to the proportions of the preceding rise in price and/or time. Our monthly chart shows the simplest scenario, which is also the most bearish one. Apple’s stock price could follow a three-wave course downward in coming years to reach beneath the 2013 low, but probably not as far as the 2009 low.
Keeping with the primary scenario of a three-wave correction, the first of those waves – labeled [a] – probably would consist of three smaller sub-waves that we have labeled as (a)-(b)-(c). An approximate target area for downward wave (c) of [a] sits around $64 to $72. From that region, price might put in a sizable bounce, which would be interpreted by many non-Elliotticians as a head-and-shoulders pattern.
Eventually, wave [c] of the overall Apple stock correction could fall as far as the lower region shown on the chart near $34 to $45. However, that price target area is only an approximation for the primary AAPL elliott wave scenario at this point. This is subject to change as it time/price play out.
In the near future, the next important confirming signal of a decline would be a break of the trend line that connects the lows of waves [ii] and [iv] of the big impulsive rally. Depending on time, that might be in the vicinity of $87 to $89. We expect only a minor bounce from the trend line, and there should be a surge in selling if the line breaks.
On a positive note, there could be a spectacular buying opportunity for AAPL a few years from now.
Anyone who regularly gets our newsletter will receive a near-term chart later this week – one with more detailed support levels and targets. Click here to request your copy!
Further reading from Tom & Kurt: Copper’s Downward Trend May Resume Soon
Twitter: @TradingOnMark
No position in any of the mentioned securities at the time of publication. Any opinions expressed herein are solely those of the author, and do not in any way represent the views or opinions of any other person or entity.


