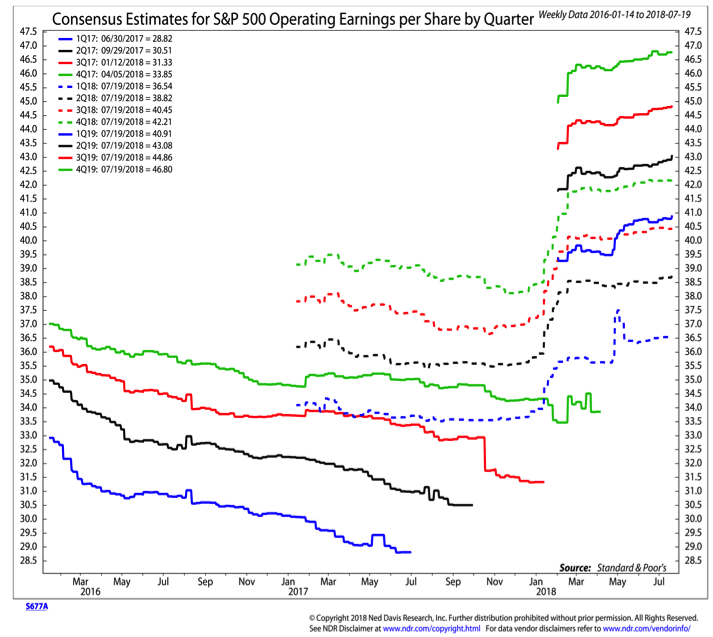
Getting into the weeds on earnings expectations (the chart here shows the evolution of quarterly earnings expectations for last year, this year and next year) shows some reasons for optimism and also caution. Optimism comes from the breaking of the pattern of initially higher estimates that drift lower over time.
Estimates for 2018 were boosted by the passage of last year’s tax-cut package, and estimates for 2019 have large tracked those for 2018. The caution comes from the lack of sustained increase in estimates.
After the initial tax cut-related jump and any current quarter improvements, estimates for future quarters have not moved meaningfully higher. If the economy is building sustainable momentum, we would expect to see a more meaningful up-tick in earnings estimates for future quarters.

Sentiment is Neutral.The plethora of sentiment surveys (CNN Fear/Greed, Investors Intelligence, NAAIM, AAII to name just a few) can make it difficult to gauge sentiment especially at times when there are somewhat mixed signals (which is more often than not). Relying on sentiment composites, which blend the results of the various individual surveys, can provide a more comprehensive view of sentiment. While the NDR Trading Sentiment Composite gives a good short-term view of sentiment (currently neutral but moving toward optimism), the Crowd Sentiment Poll (also produced by Ned Davis Research) offers a more stable view of sentiment. Right now it shows excessive optimism has re-entered the market.
In contrast to the views expressed in the sentiment surveys, fund flow data show a more cautious stance among investors. Equity funds have seen large outflows over the past four weeks (to the tune of $29 billion). While this is small relative to the overall amount of assets in mutual funds and ETFs (which is in the trillions of dollars), at the margin it reflects caution. Stocks have historically done well when flows are negative and have struggled during periods of inflows. Given the optimism seen in the sentiment surveys, evidence that investors are shifting funds back into equities could prompt us to downgrade our view of sentiment from neutral to bearish.
Seasonal Patterns are Bearish.For stocks overall, the weakest portion of the presidential election cycle is the months leading up to mid-term elections. This is even more so the case with small-caps (the chart here shows small-cap performance relative to large-caps). The caveat with seasonal patterns is that sometimes they work and other times they are less reliable. Two factors right now suggest they are worth paying attention two. First, as the chart shows, small-caps are starting to see weakness relative to large-caps. This is early evidence that the typical pattern is unfolding. Second, the price rally in the popular averages has come without corresponding strength in momentum. The lack of upside momentum could leave stocks vulnerable to reversal at a time when seasonal headwinds are pretty stiff to begin with.
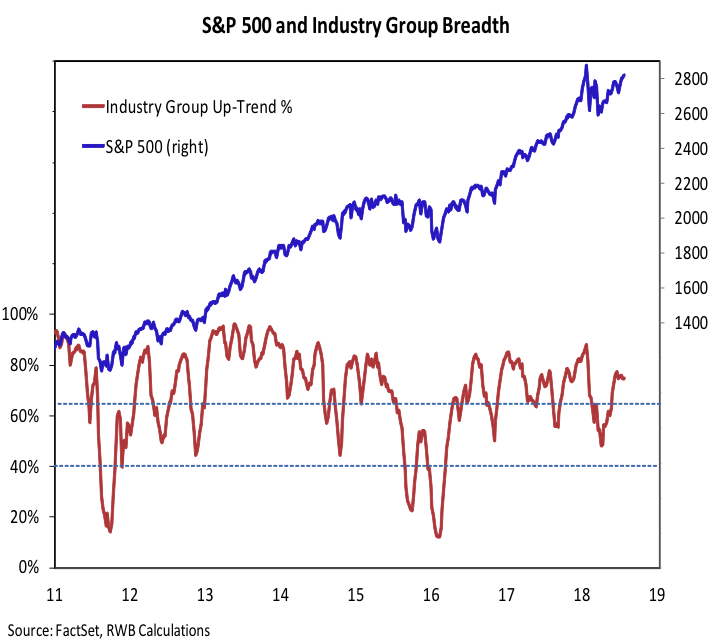
Breadth remains neutral.We have not seen sufficient strength from the broad market indicators to confirm the recent gains in the popular averages, but we have also not seen the types of divergences that argue that downside risks have expanded significantly. In other words, the average stock has seen some improvement but the popular averages are increasingly dependent on a narrowing list of stocks to provide support. One way to look at this is through the lens of our industry group breadth indicator. The percentage of industry groups in up-trends expanded as the S&P 500 moved off its early year low. That expansion has since stalled and now lags the improvement seen in the S&P 500.
Twitter: @WillieDelwiche
Any opinions expressed herein are solely those of the author, and do not in any way represent the views or opinions of any other person or entity.


