When the votes were tallied and the surprise outcome became apparent last week, equity indexes around the world began to fall precipitously (along with almost every other asset class that doesn’t qualify as a “safe haven”). Reports quickly surfaced, thanks largely to social media, of sophisticated quant funds, macro geniuses and other investing savants who had seen what the so-called experts had not and had profited handsomely.
While it might be fun to read tales of trading windfalls, it’s safe to assume that many of us were regretting our net long exposure on Friday morning as the opening bell saw a steep Brexit gap lower. Many of us were wondering what we missed.
But prior to Friday’s selloff, if you were following the standard technicals and letting price action dictate your exposure, it’s likely that you were doing the right thing.
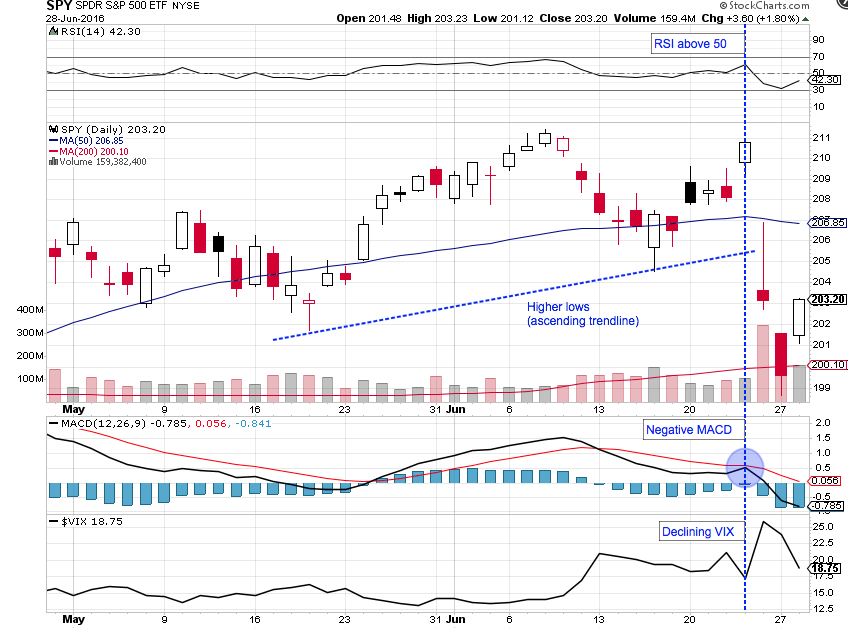
Looking at the S&P 500 ETF (SPY) chart, we can see that the index was putting in higher lows. It also had a 50 day moving average above the 200 (and a price above both), and an RSI above 50. Only the MACD reading was diverging. Even the VIX was declining as the SPY headed back towards the 211 level. There weren’t many signs pointing to a big short.
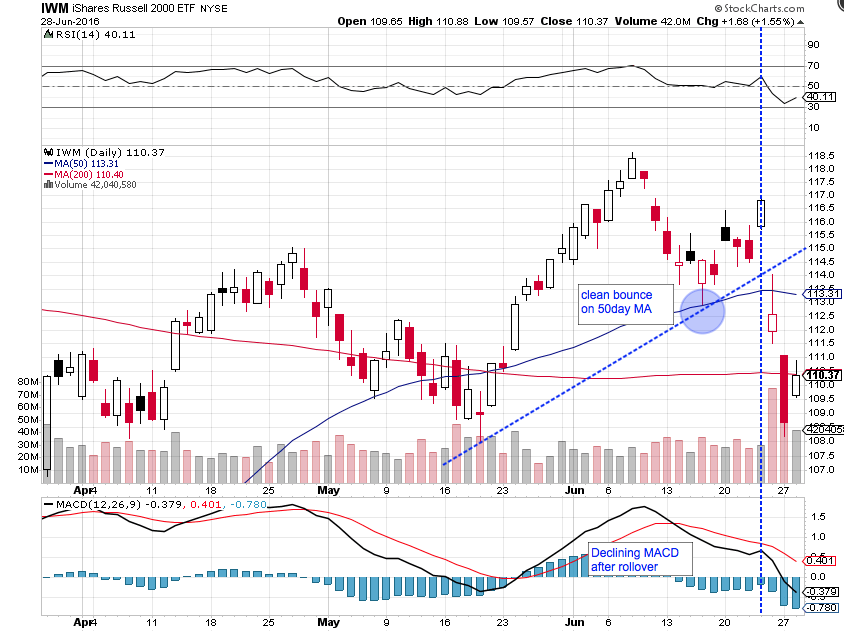
The Russell 2000 ETF (IWM) chart tells much the same story. Again, only the MACD suggested that the upward trajectory might be compromised. But with the clean retest and bounce off the 50 day moving average, could you blame a swing trader for being long the small caps?
The lesson to take from all this is not that you missed something or that you erred by following price action. It’s to reaffirm that you can follow your system and adhere to what the chart is telling you and still get it wrong. The Brexit gap lower on Friday morning stung a lot of people.
That’s simply part of trading. Thanks for reading.
Any opinions expressed herein are solely those of the author, and do not in any way represent the views or opinions of any other person or entity.


