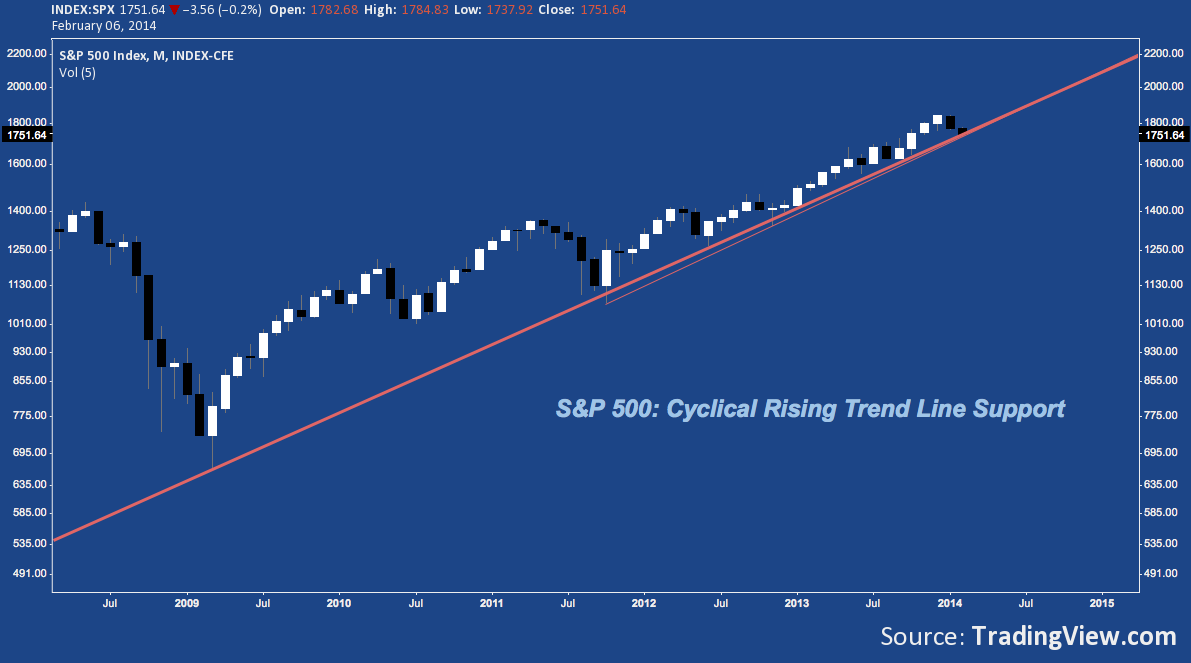
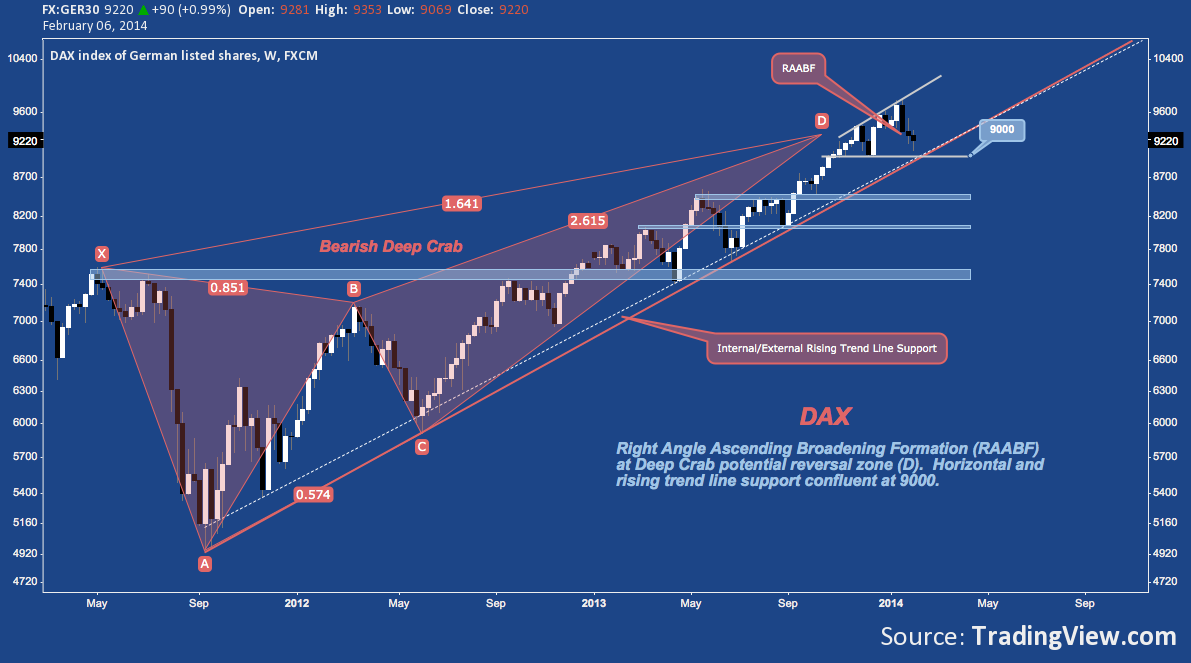
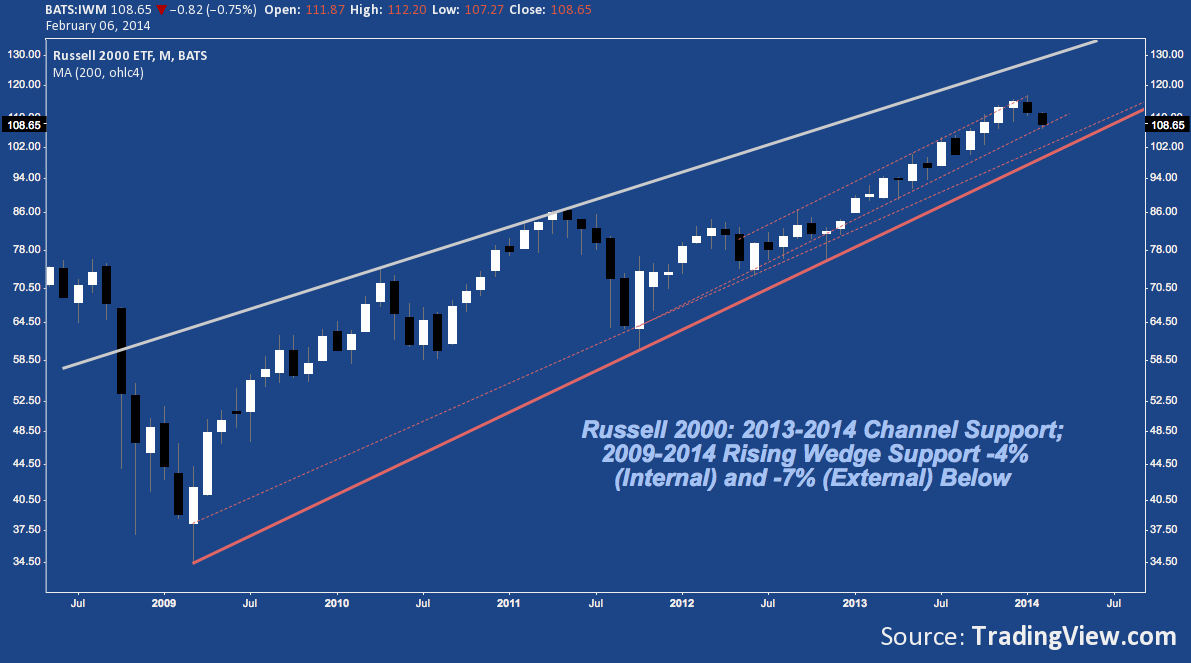
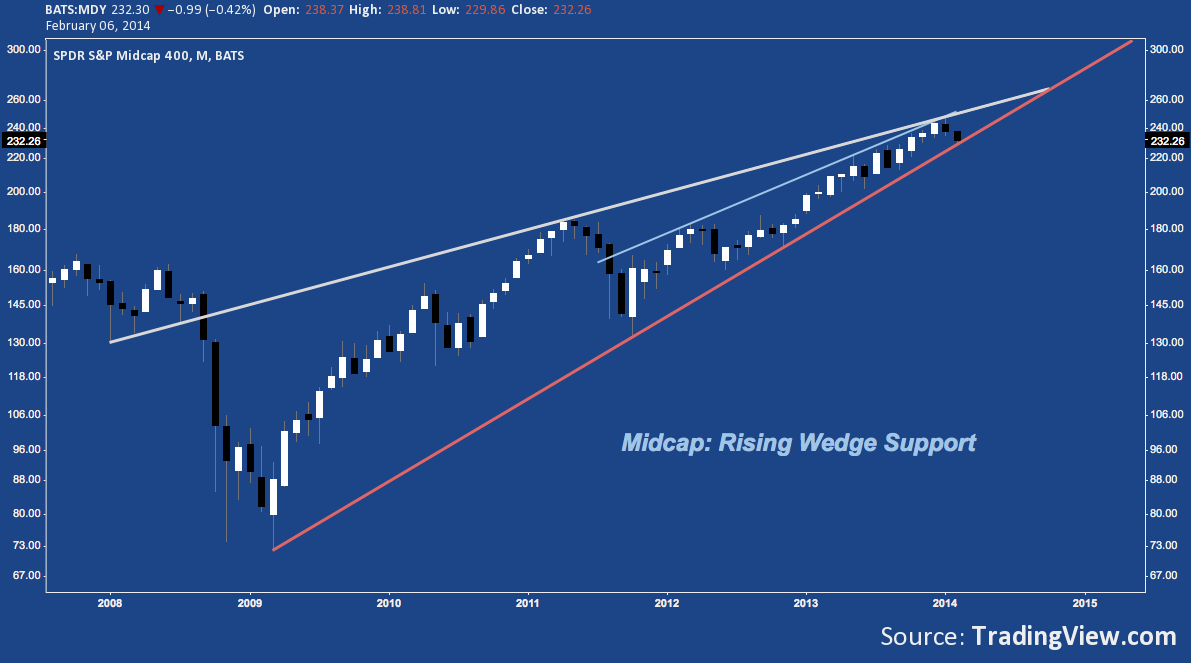
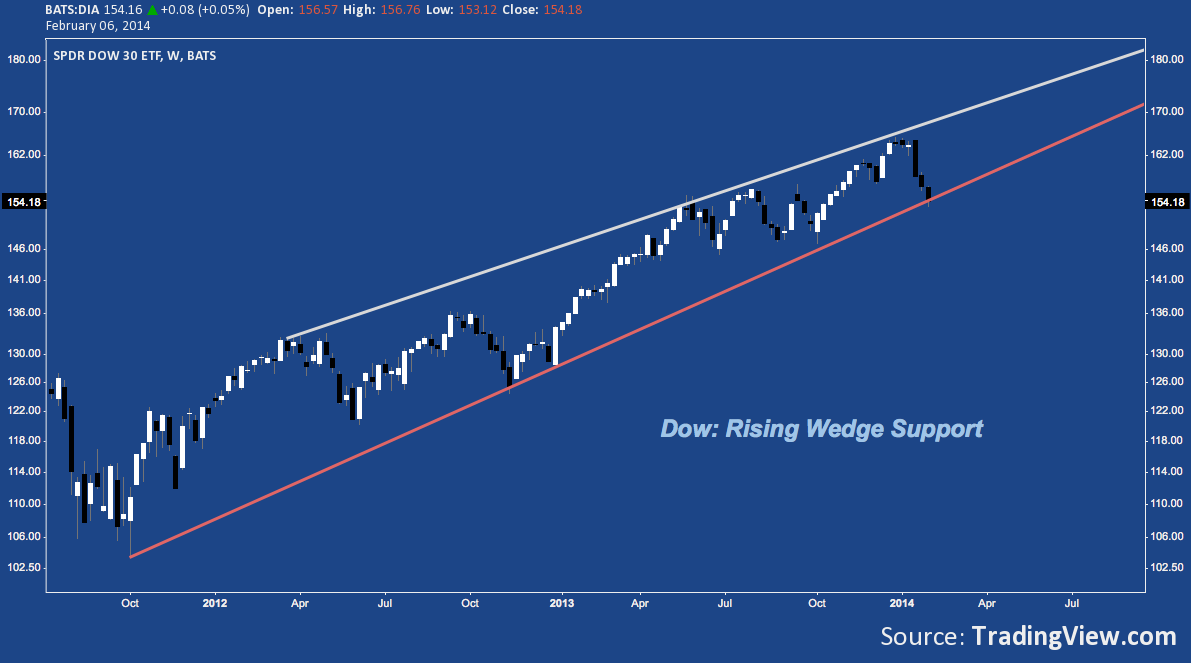
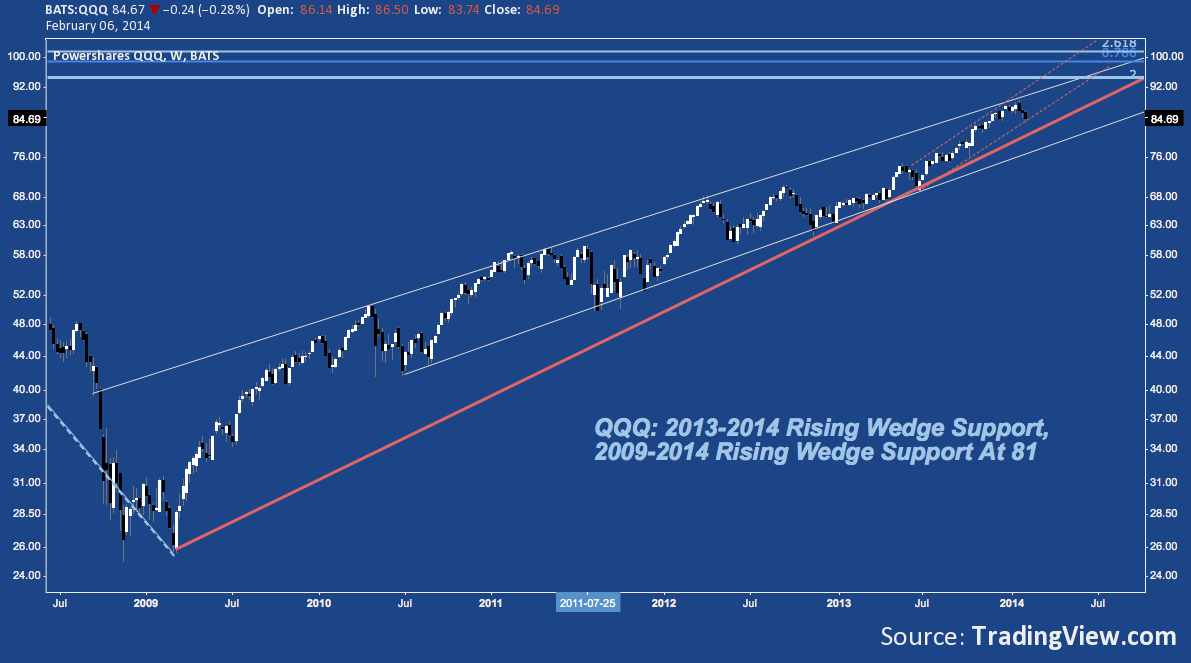
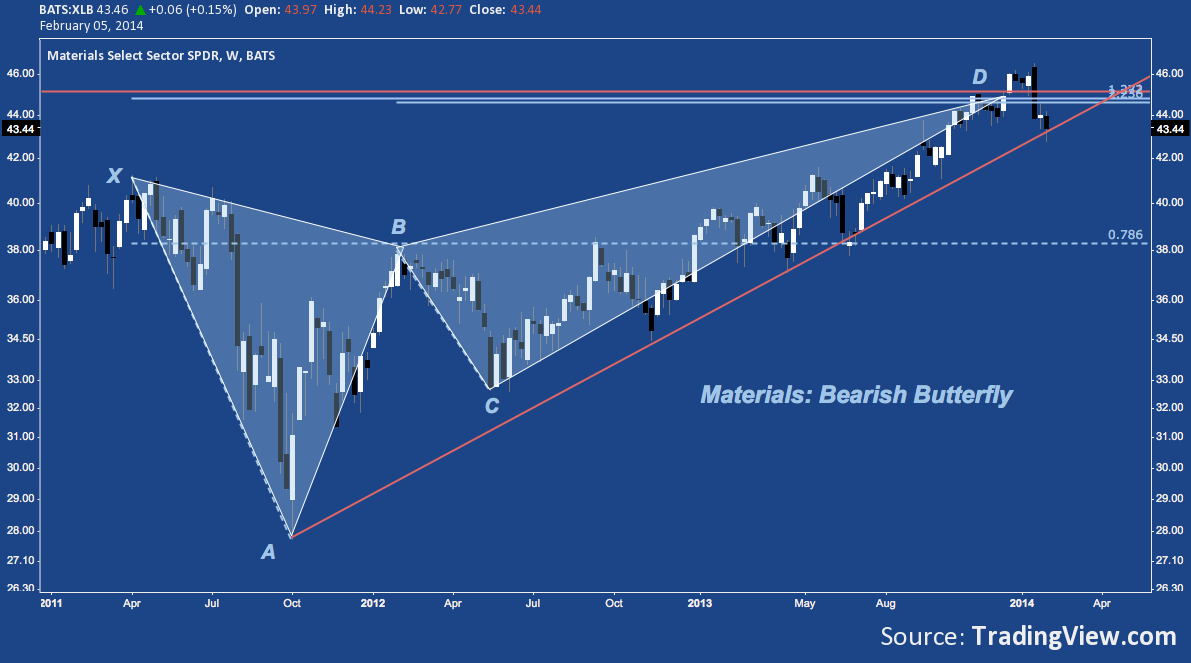
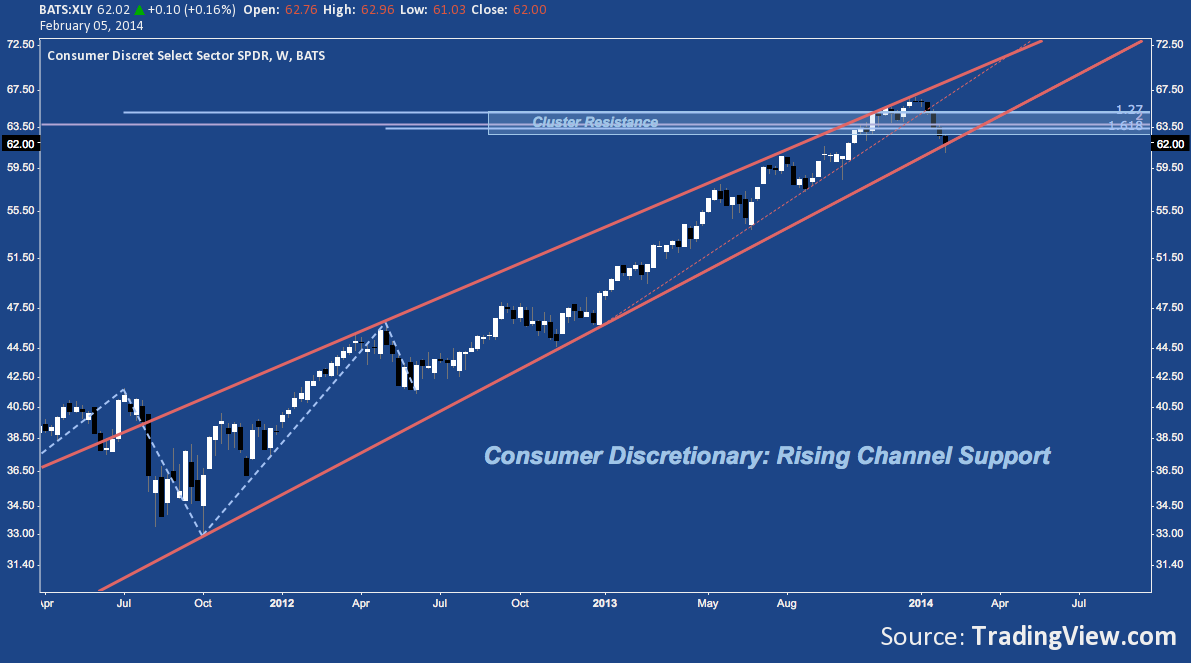
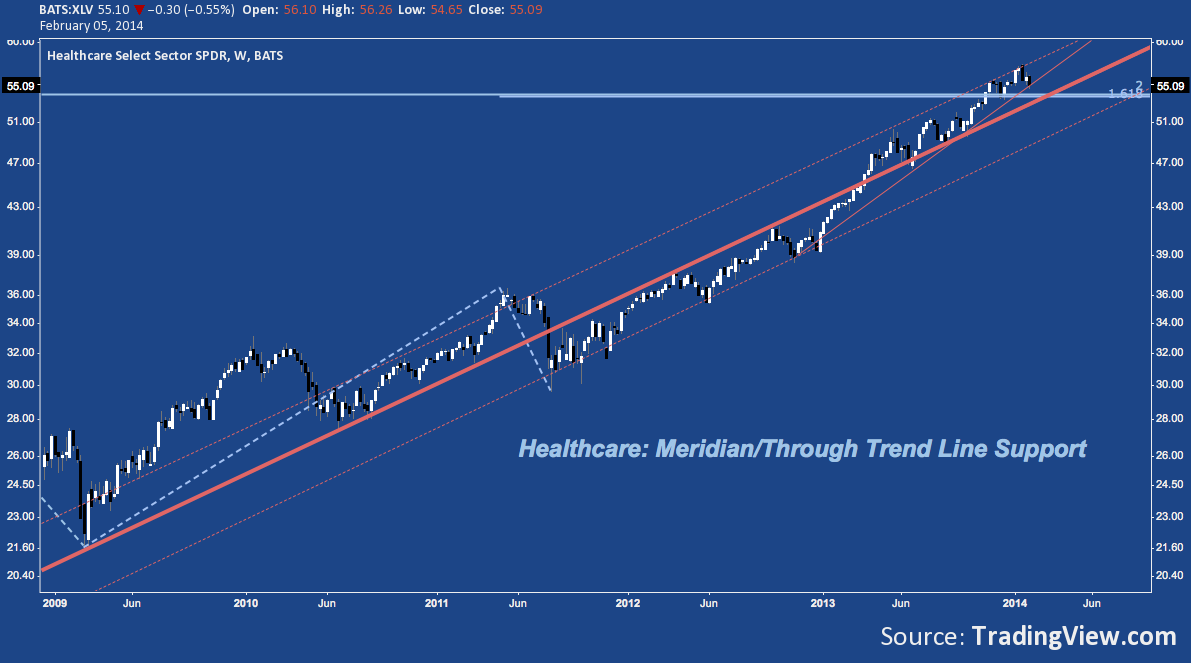
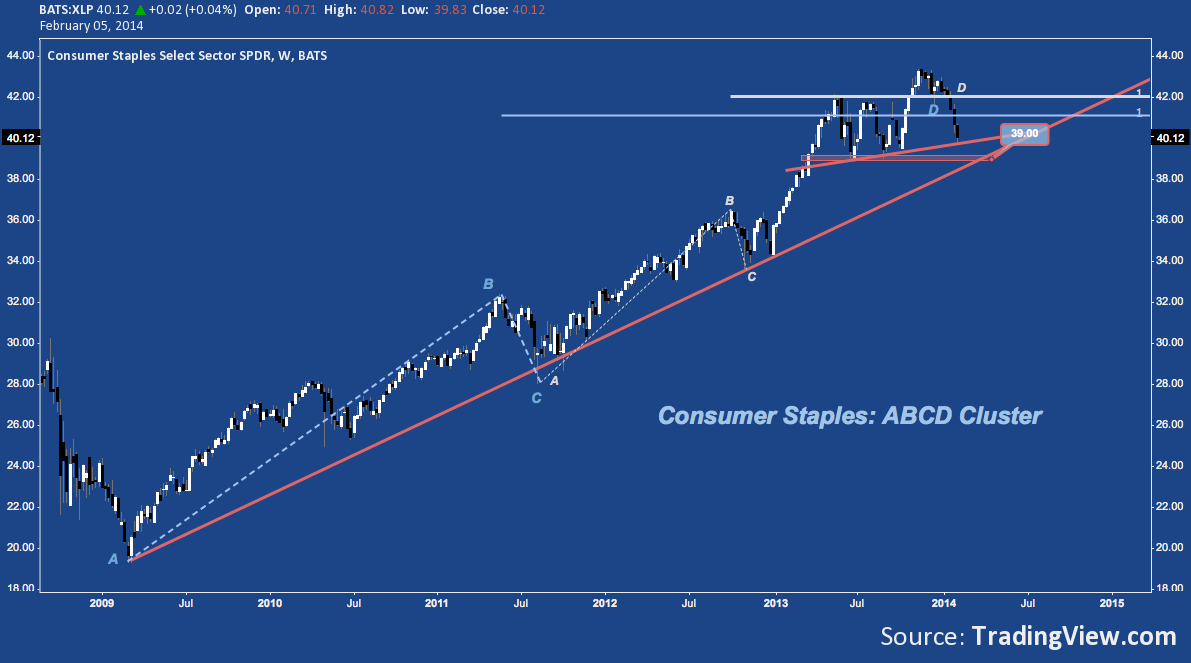
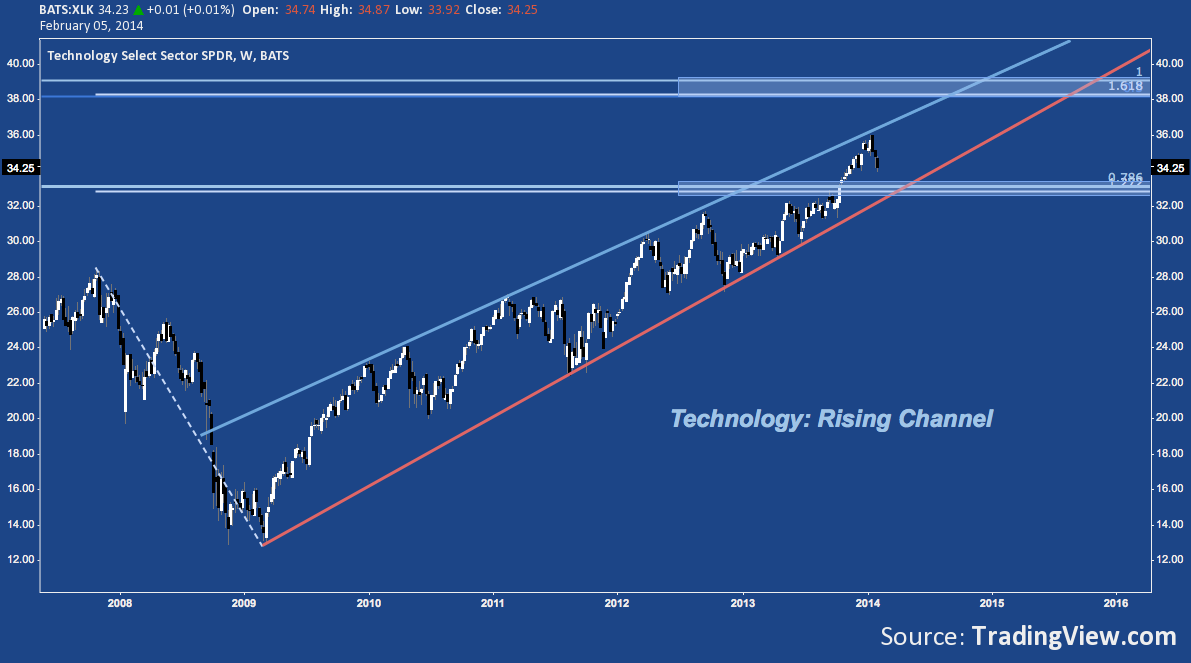
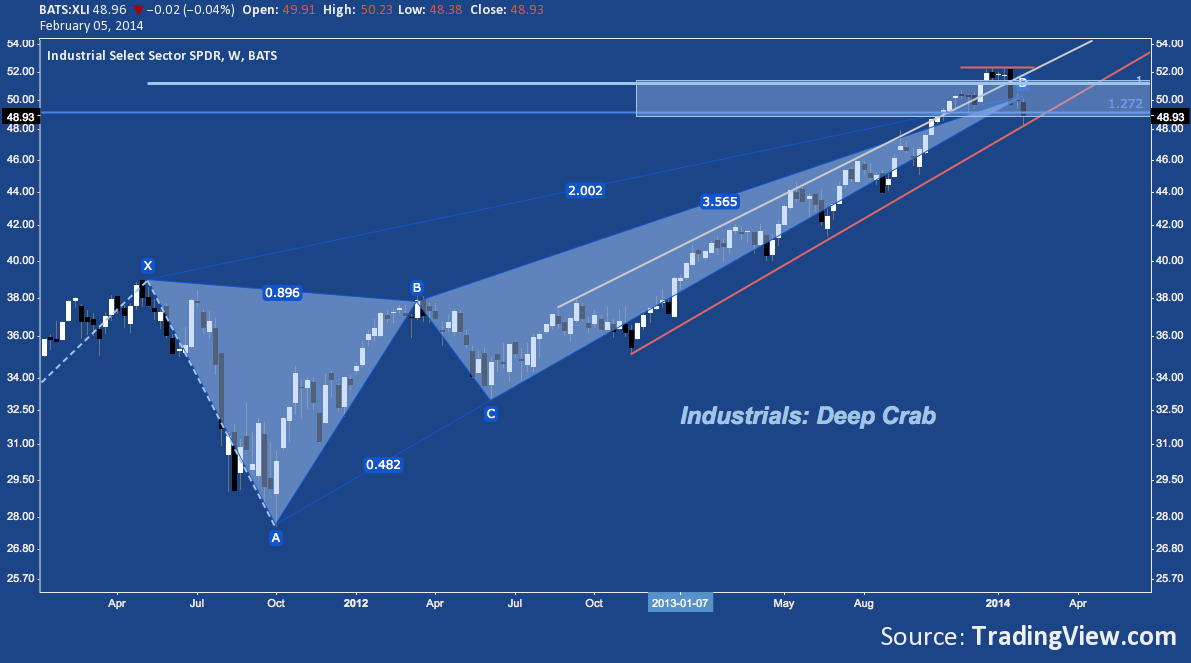
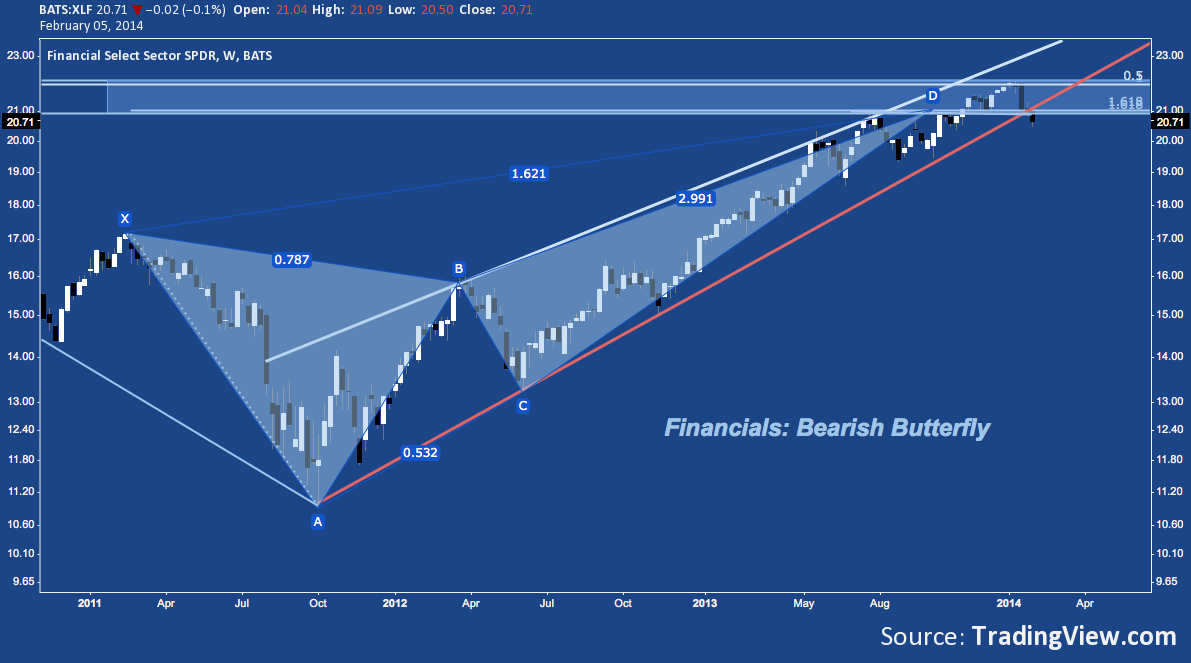
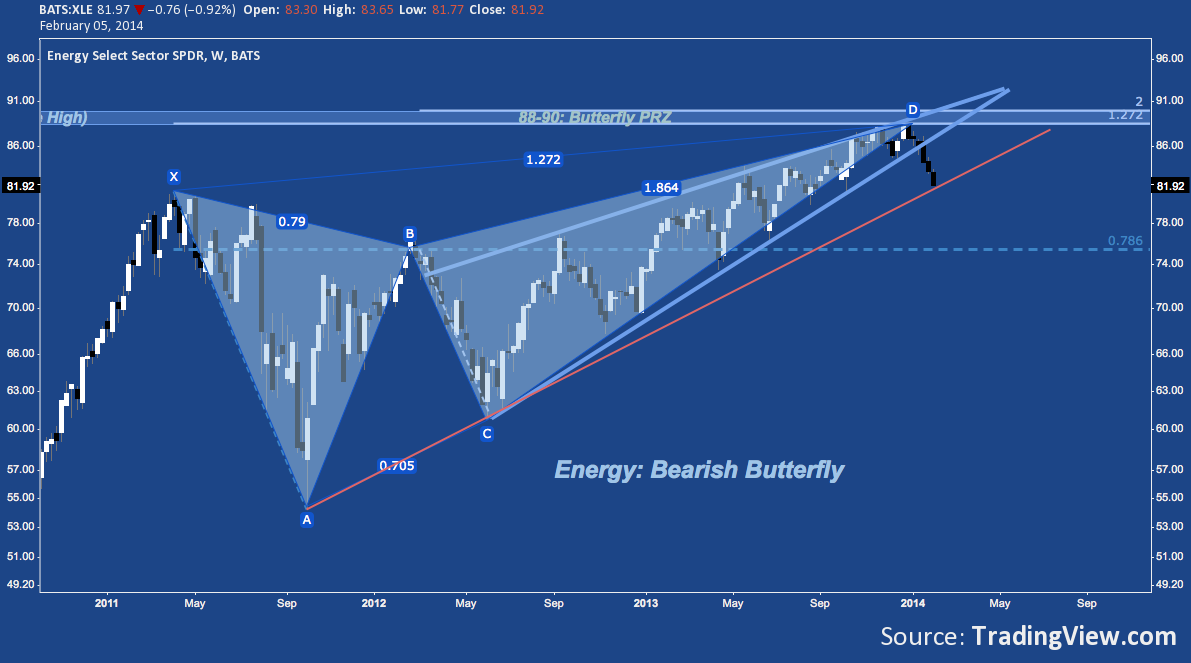
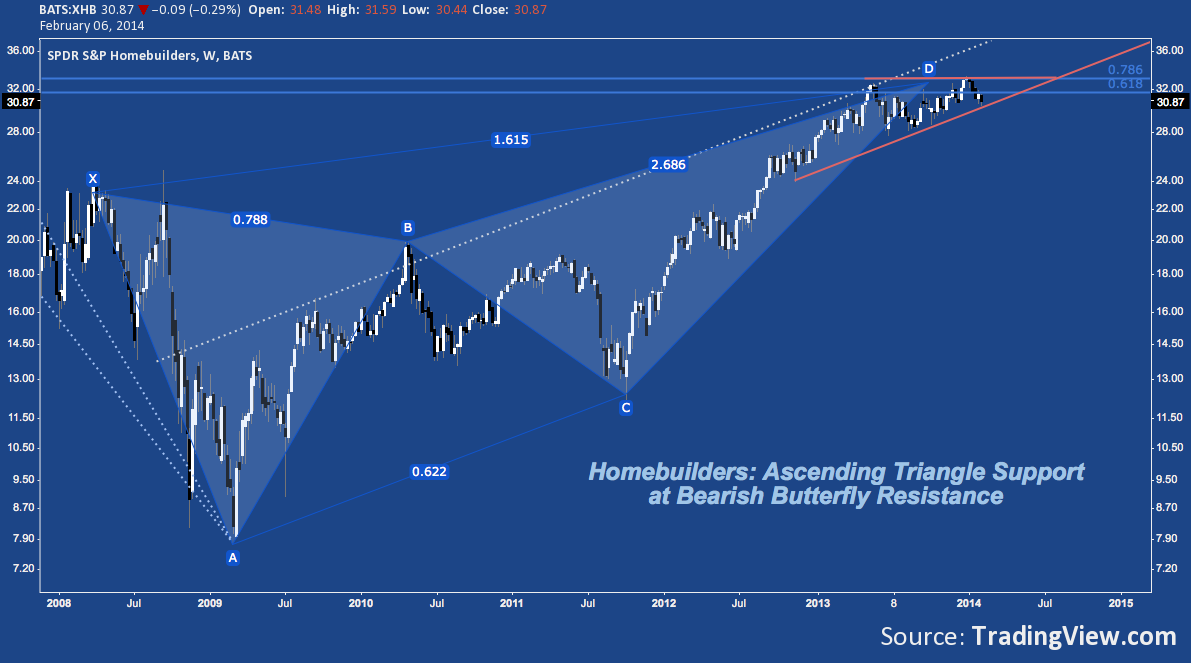
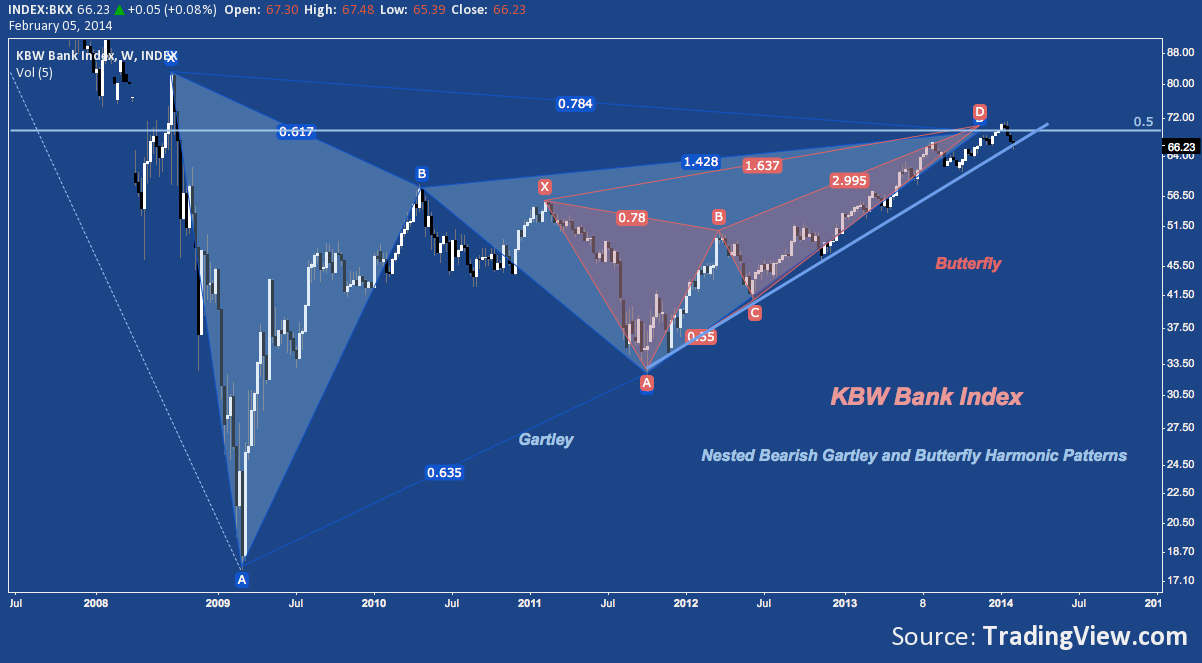
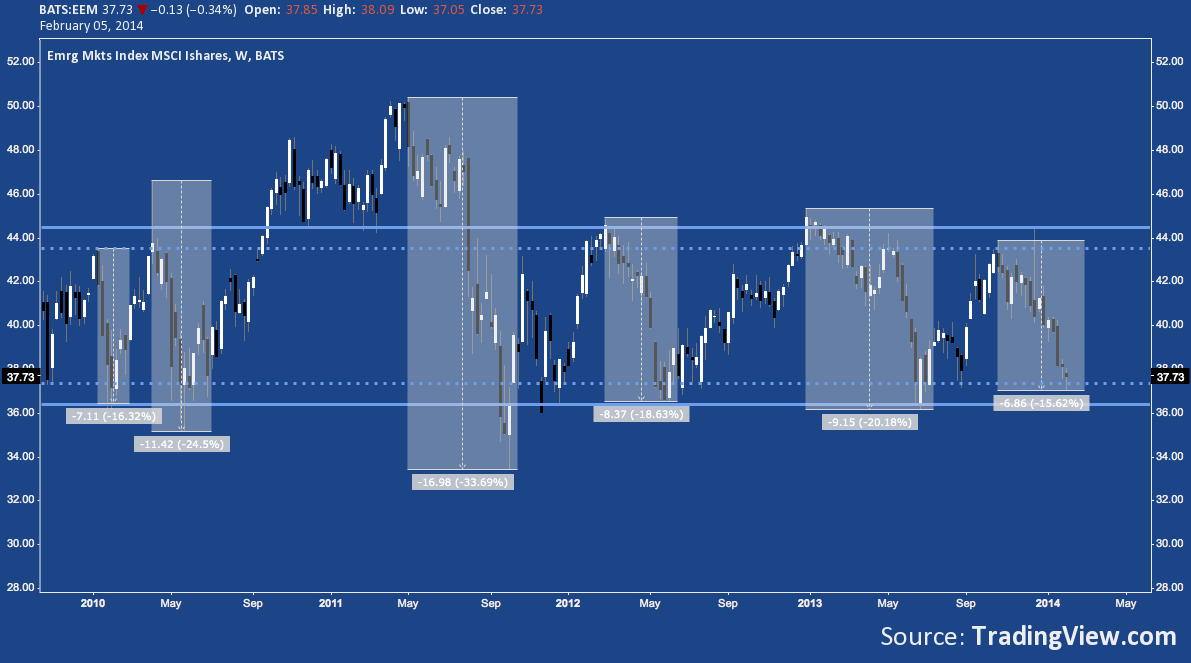
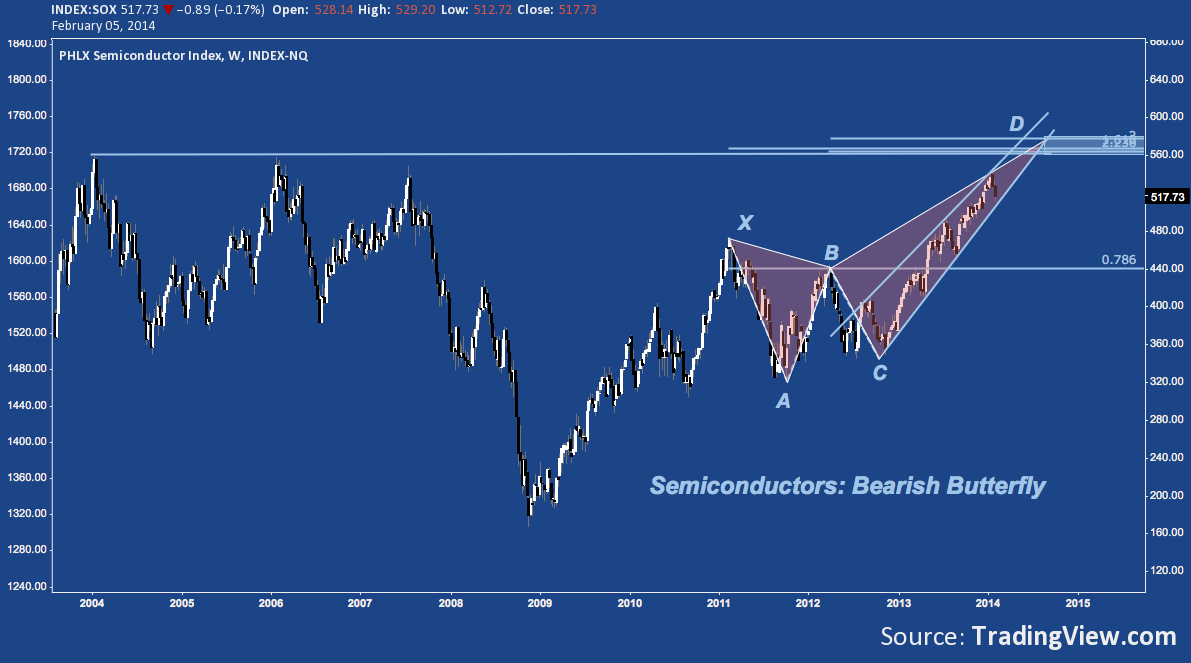
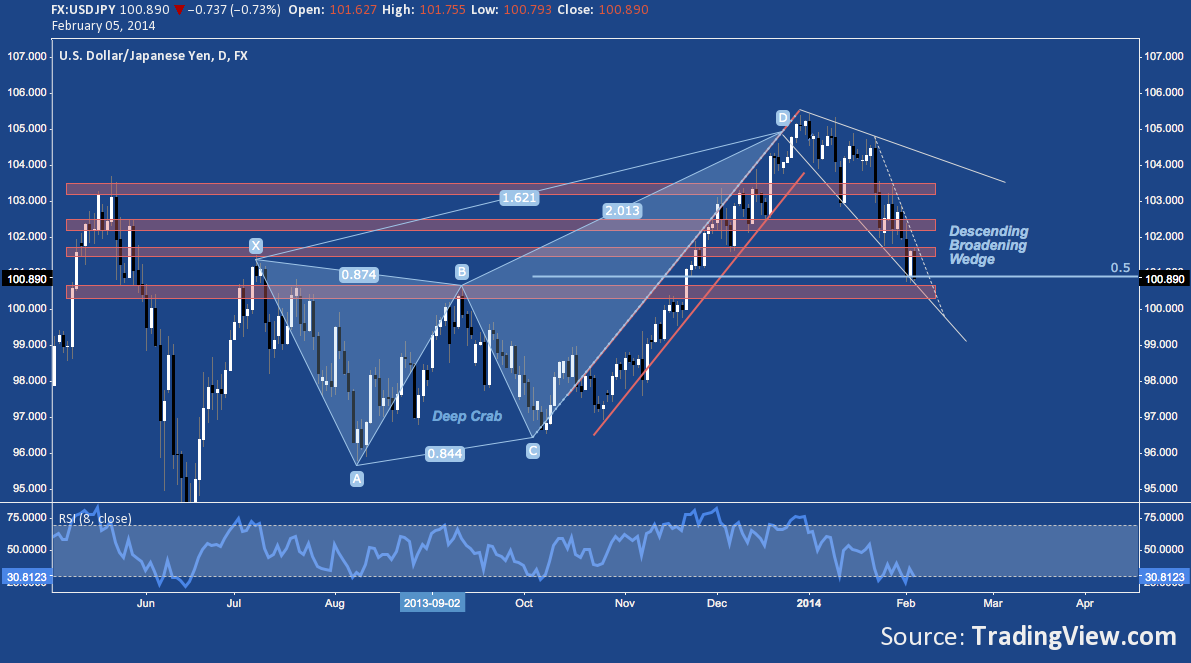
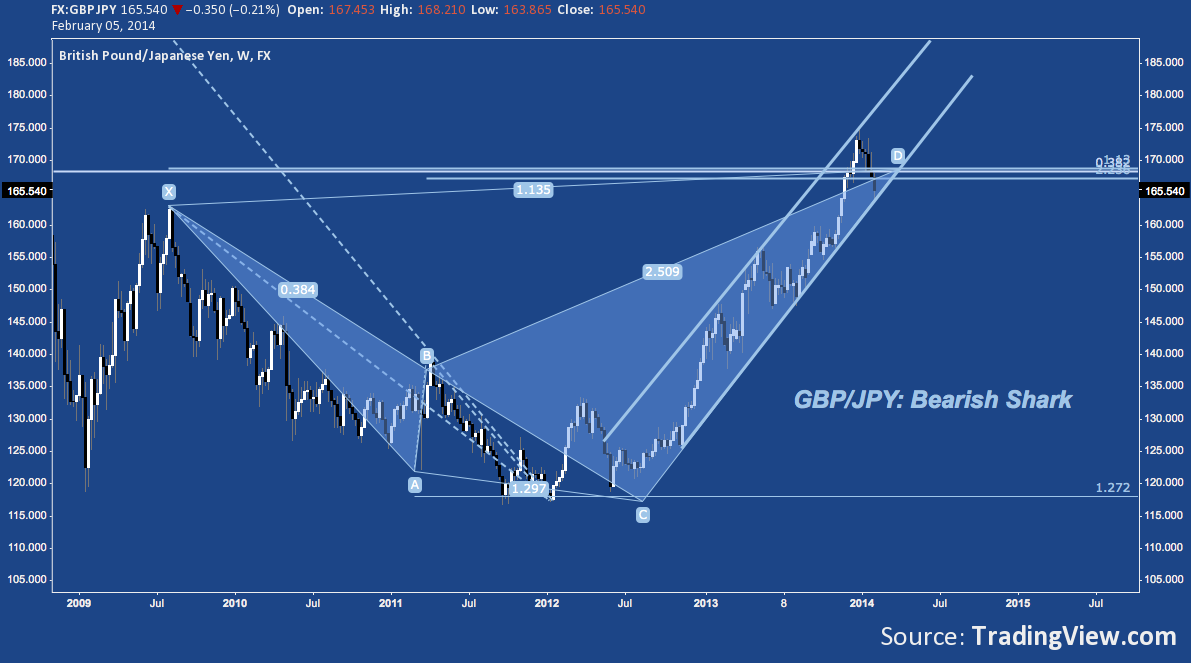
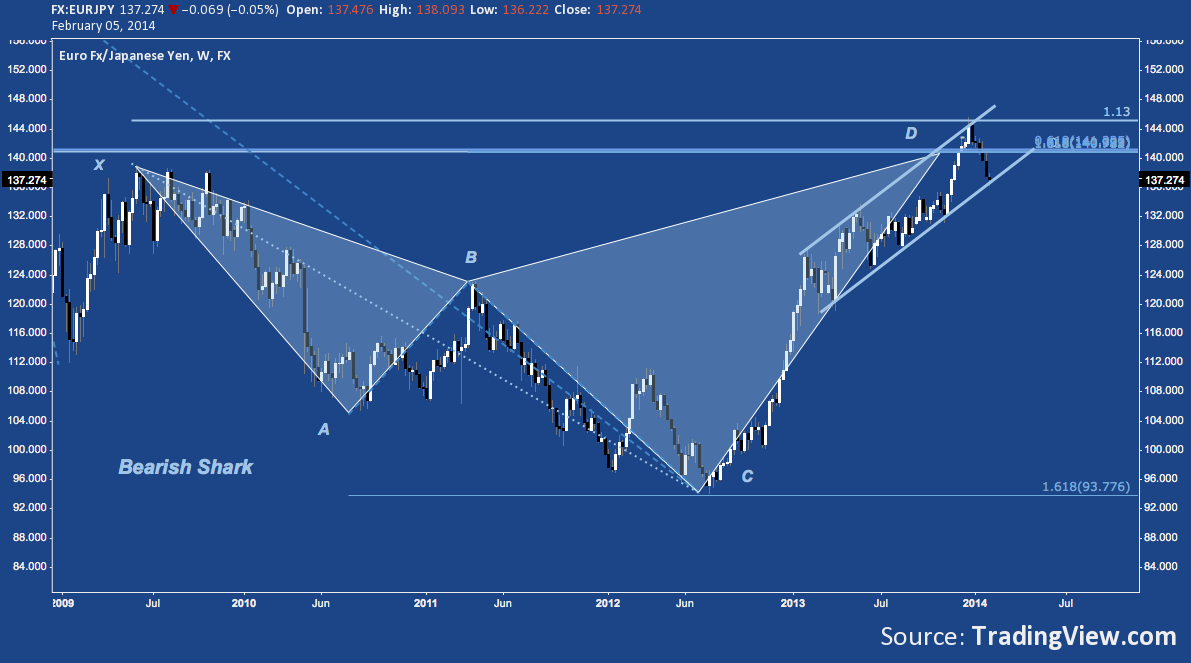
 The routine series of technical scans I run each market day have little-by-little turned over a rock and found something the past couple sessions that all the weeping and gnashing of teeth over the S&P 500’s -6.2% pullback from January’s all-time highs has predictably missed: many popular market measures have reached trend line support. In more than a few cases, major multi-year support.
The larger context in almost every case here is a bearish one: price is nearing the apex of an unsustainably acute rising wedge, being rejected off an ABCD target building since 2009’s lows, or crumbling beneath the pall of a bearish harmonic pattern begun in 2011 or even 2007. As an investor or long-term position trader, these are the patterns to acknowledge and for which to prepare.
But on shorter time horizons, risk management demands that it’s time to consider: until the lines break on this selection of 25(ish) charts – which would likely happen all at once, given their prevalence and uniformity – this pullback may be over.
If a market rally is going to build without moving into a deep correction, right here and now stands as an excellent candidate for a reassertion of bullish control.
Major Indices:
Sector ETFs:
Industry/Specialized ETFs:
Japanese Yen Crosses (carry trade, RoRo proxy):
Twitter: @andrewunknown and @seeitmarket
Author carries net long Russell 2000 exposure the time of publication. Commentary provided is for educational purposes only and in no way constitutes trading or investment advice.
Any opinions expressed herein are solely those of the author, and do not in any way represent the views or opinions of any other person or entity.

