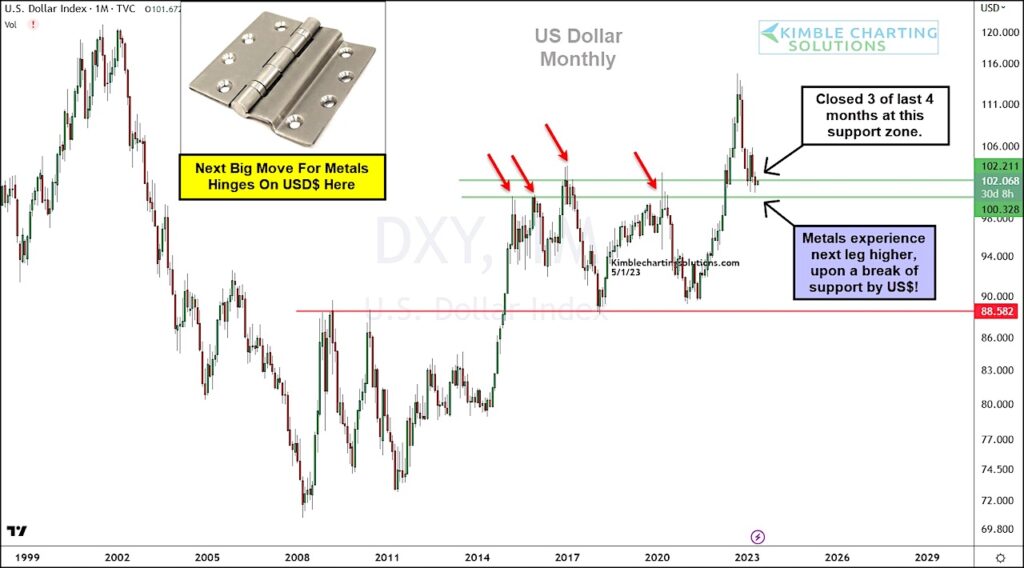
When the US Dollar broke out to new highs last year, it looked like nothing could stop the greenback. And the headwind of a strengthening Dollar made it difficult for precious metals like Gold and Silver to advance.
BUT… King Dollar has fallen nearly 15% from its highs and 3 of the past 4 months have closed very near the important support zone of 100-102. This suggests that there has been little conviction of late. And this has provided a tailwind for precious metals.
The long-term “monthly” U.S. Dollar chart (below) highlights the breakout above the “red arrows” zone (100-102), along with the recent testing of that zone.
Note that the 2% zone of 100-102 has been support or resistance numerous times over the past 8-years, making this a critically important area to watch on a monthly closing basis.
Precious metals bulls should experience a fun price ride should support fail to hold here. Definitely something to watch. Stay tuned!
U.S. Dollar Index “monthly” Chart

Note that KimbleCharting is offering a 2 week Free trial to See It Market readers. Just send me an email to services@kimblechartingsolutions.com for details to get set up.
Twitter: @KimbleCharting
Any opinions expressed herein are solely those of the author, and do not in any way represent the views or opinions of any other person or entity.


