The Precious metals industry hasn’t had much to get excited about over the past 5 to 7 years.
After peaking in 2011/2012, Gold and Silver prices fell sharply before trading sideways for several years.
So it’s been a traders market, with opportunities on both the long and short side.
But Gold is charging higher again, fueled by talk of global trade wars, dovish monetary policy, and a potential topping pattern on the US Dollar.
The US Dollar Index is a good indicator to watch regarding U.S. Gold prices. When King Dollar is weak, it is a tailwind. And when King Dollar is strong, it is a headwind.
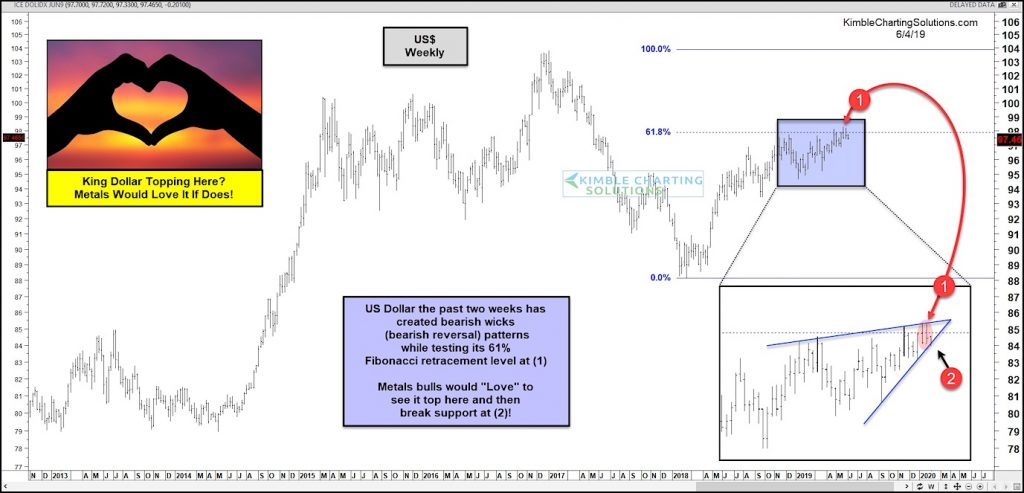
Over the past two weeks, the US Dollar has created bearish wicks on its weekly candles. This comes while it’s testing the 61.8 Fibonacci resistance level (1).
It’s also formed a bearish rising wedge pattern that would be confirmed by a move below support (2). Could a trading top on the US Dollar be the catalyst to spring Gold prices higher?
Metals bulls would love to see King Dollar top at (1) and a break of support at (2). Stay tuned!
US Dollar “weekly” Chart

Note that KimbleCharting is offering a 2 week Free trial to See It Market readers. Just send me an email to services@kimblechartingsolutions.com for details to get set up.
Twitter: @KimbleCharting
Any opinions expressed herein are solely those of the author, and do not in any way represent the views or opinions of any other person or entity.


