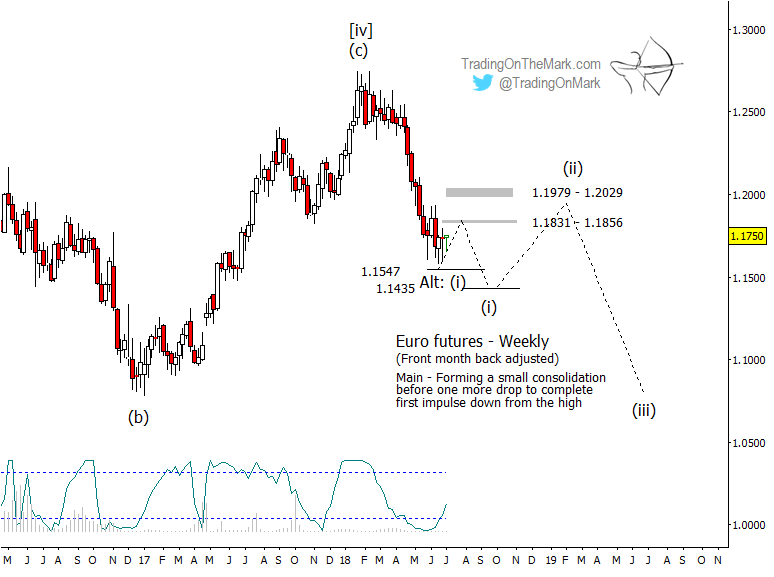
Euro futures are following the bearish path we described as the main scenario when we last wrote about this topic in January.
This post highlights some of the upcoming trades that should materialize if that scenario with the Euro (CURRENCY:EURO) and/or Euro Currency ETF (NYSEARCA:FXE) continues to play out.
Keep in mind that the alternate bullish scenario for the Euro has not yet been invalidated. However the bearish Euro picture is consistent with our long-term bullish Elliott wave count for the U.S. Dollar, which we last updated here at See It Market in early May.
We believe the Euro is tracing a lengthy five-wave decline from its 2011 high, with sub-wave [iv] of that sequence having been completed at the high that arrived early this year. The strong decline during recent months agrees with the idea that the downward impulsive sub-wave [v] has begun.
The first component of downward wave [v] should itself be a five-wave impulsive sequence. While the 2018 price decline on the chart has the right look for (i) of [v], it may not be quite finished. Traders already short the Euro might play for one of the support areas near 1.1547 and more likely 1.1435.
In fact, a near-term upward retrace to test one of the resistance zones near 1.1831-1.1856 or 1.1979-1.2029 might offer another chance for a relatively fast trade down into lower support.
Here’s a look at the chart…
Euro Futures Elliott Wave Chart
On a larger scale, a pause or upward retrace should arrive later this year as wave (ii) of [v]. The prospect of riding upward wave (ii) during the summer or autumn is not outlandish, but the move will probably be choppy. On this time frame it is usually easier to trade the impulsive components of larger impulsive waves and to leave the corrective waves alone.
With morning and evening updates every trading day, Trading On The Mark offers charts and analysis on time frames ranging from weekly to intraday for the S&P 500, crude oil, the Euro, Dollar Index, treasury bonds, and gold.
This summer, we’re making a special offer available for extra savings. Take out a year-long subscription to our Daily Analysisservice and we’ll deduct the cost of three months of service. Basically you get a whole summer of charts for free! The coupon code to take advantage of this offer is “summer”.
Twitter: @TradingOnMark
The authors may have a position in the mentioned securities at the time of publication. Any opinions expressed herein are solely those of the author, and do not in any way represent the views or opinions of any other person or entity.


