Although Platinum has had short bursts of outperformance vs Gold (Platinum-Gold Ratio), it’s basically been in an underperformance cycle for several years. But that underperformance may be coming to an end.
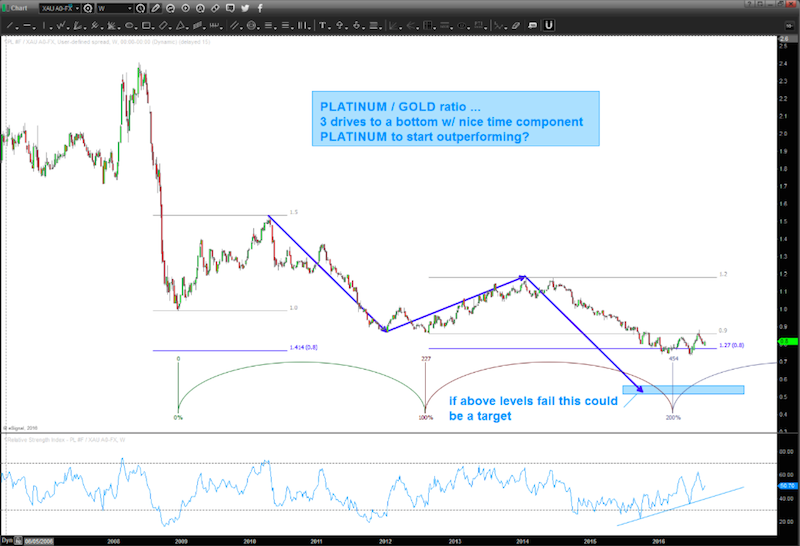
Below is a chart of the Platinum-Gold Ratio (the ratio of platinum prices to gold prices). As you can see Platinum swung to new multi-year lows relative to Gold this year. But there’s more to it than that.
I think there’s a pretty good chance that Platinum starts to outperform Gold. Why? Notice the 3 drives lower to a bottom with good time symmetry.
I’ve also identified some key levels from a math and geometry perspective. If these levels fail, then I would suspect a lower target (and some continued weakness). But it sure looks like the RATIO wants to move higher…
Platinum-Gold Ratio Performance Chart
More from Bart: Home Depot Hits Price Target: Time For A Pullback?
Thanks for reading.
Twitter: @BartsCharts
Author does not have a position in mentioned securities at the time of publication. Any opinions expressed herein are solely those of the author, and do not in any way represent the views or opinions of any other person or entity.


