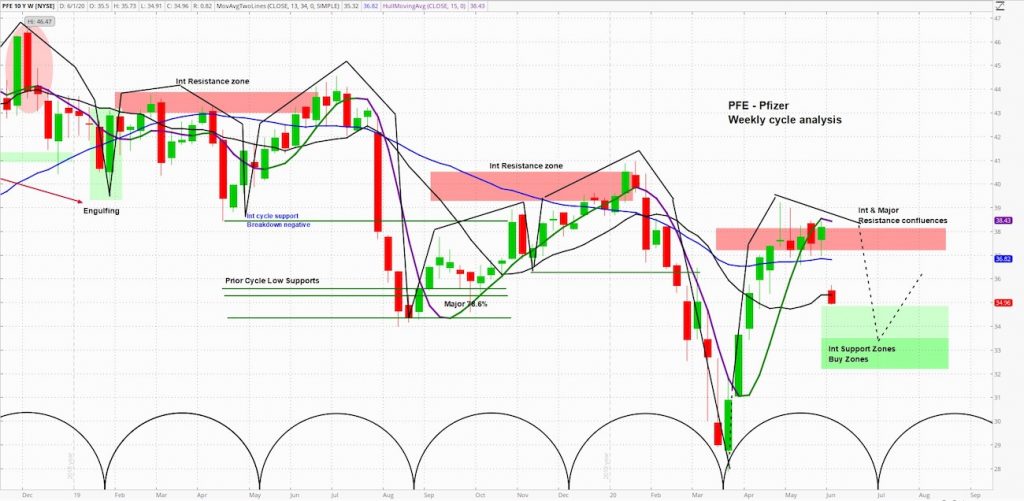
Pfizer NYSE: PFE Weekly Chart
On Friday, Pfizer (PFE) announced they had halted a Phase 3 breast cancer drug trial as the results were unlikely to meet their primary endpoint.
Today, PFE is down over 8% midway through the U.S. trading session.
Let’s review the weekly cycle analysis.
At askSlim we use technical analysis to evaluate price charts of stocks, futures, and ETF’s. We use a combination of cycle, trend and momentum chart studies, on multiple timeframes, to present a “sum of the evidence” directional outlook in time and price.
askSlim Technical Briefing:
The weekly cycle analysis suggests that PFE is in a declining phase in an overall bullish cycle pattern.
The next projected intermediate-term low is due in July. Weekly momentum is now negative.
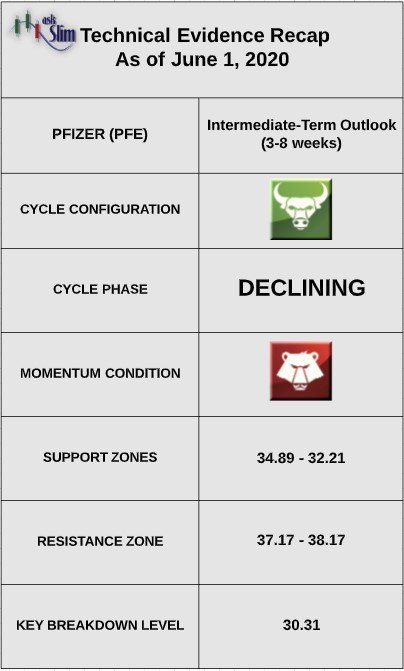
On the upside, there is a Fibonacci resistance confluence zone from 37.17 – 38.17.
On the downside, there are Fibonacci support zones from 34.89 – 32.21. For the bears to regain control of the intermediate-term, we would need to see a weekly close below 30.31.
askSlim Sum of the Evidence:
PFE is in a declining phase in an overall positive pattern. We see a likelihood that the stock trades down to 34 by July. However, this pullback will likely set the stage for another rally into the fall.
TABLE
Interested in askSlim?
Get professional grade technical analysis, trader education and trade planning tools at askSlim.com. Write to matt@askslim.com and mention See It Market in your email for special askSlim membership trial offers!
Twitter: @askslim
Any opinions expressed herein are solely those of the author, and do not in any way represent the views or opinions of any other person or entity.
: Creating Bullish Divergence?")


 and Semiconductors (SMH): Concerning Price Pattern?")


