Perhaps the most repeated phrase found in financial reports, commentaries or investment literature is “past performance is not indicative of future results”.
The line is tucked neatly away in the disclaimer. This phrase was not created by lawyers to avoid litigation risk (although they likely helped), it is based on many academic studies over time that have found this to be true.
But the lure to chase performance is so strong – thanks to human nature, the fear of missing out, greed – that it’s easy to resort to thinking “disclaimer be damned, let’s make some money!”
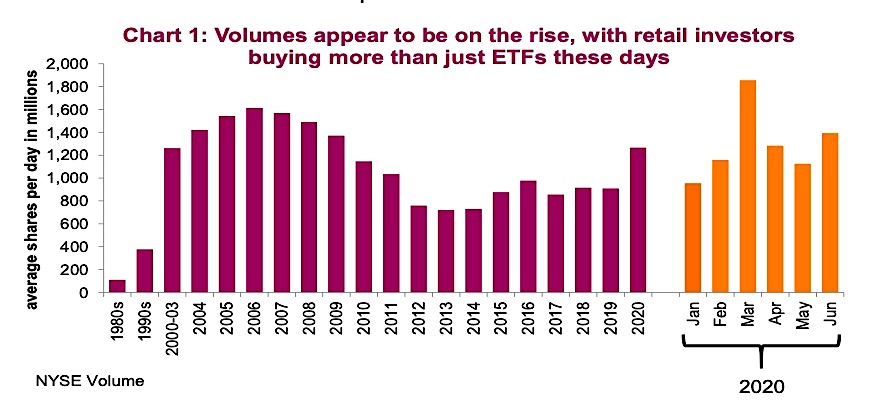
This has been the mantra of many retail investors getting back into the market, buying individual stocks again. Citadel estimates that retail-driven volume represents about 25% of the market in 2020, up from 10% in 2019.
This has helped lift volume higher in 2020, and not just during the months of February/March, which experienced higher market volatility.
Market trading volume has changed over time based mainly on market structure, costs and participants. In the early 2000s, there was an explosion in volume as high frequency traders (HFT) became material market participants. This slowed after 2008 given new rules for banks and proprietary trading. From 2010 onwards, the rise of ETF popularity likely supressed volume.
Think about it, you can buy the S&P 500 with one trade instead of buying a handful of individual companies. But in 2020, we are seeing a rise in volume driven by a return of the retail investor into individual equities.

The fact is, direct investing is probably a rather safe activity in this environment – it’s easy to remain socially distanced with no face mast required. In a world where boredom is much more prevalent, “playing the market” with some mad money could be a nice distraction. This is certainly contributing to the activity. However, the bigger attraction is likely the gains that are being made in many pockets of the market. This changing behavior is helping feed those gains , which then feeds that behavior, bringing back some memories of the late 1990s.
Reminiscent of a tech bubble
There are certainly some similarities between the current market environment and that of the late 1990s. Valuations for many companies that are destined to change the world are no longer relevant. The names have changed, how they will change the world has changed, but the similarity remains. A few days ago, Tesla was up 318% on the year.
Shopify is in the perfect spot during this pandemic-altered environment, clearly crushing it. At 1,400x 2020 earnings, clearly valuations have little impact….at the moment. The list goes on.
While taxi drivers are not sharing their stock picks (circa 1999), this may be due to the fact that few of us are taking taxis (or Ubers) at the moment. But the volume of those bragging about their successes does appear to be on the rise.
Perhaps some of the best lessons our team learned investing through the late 1990s was (1) These things can go on much longer and potentially get bigger than anyone expects; and (2) Investors chase performance.
Performance chasing is dangerous
We are not suggesting either way that investors dabble or avoid some of these highflyers. Maybe the world is changing this time, or the trend goes on much longer or just maybe that tree does grow to the sky. The point is to be mindful of the amount of capital exposed relative to your portfolio.
Performance chasing is even more relevant in the fund/ETF world. Mountain charts, posting past performance are all marketing strategies to elicit that FOMO (fear of- missing out). And it works. But it is worth noting that while past performance does have some efficacy in investment strategy assessment, there is likely too much reliance on this.
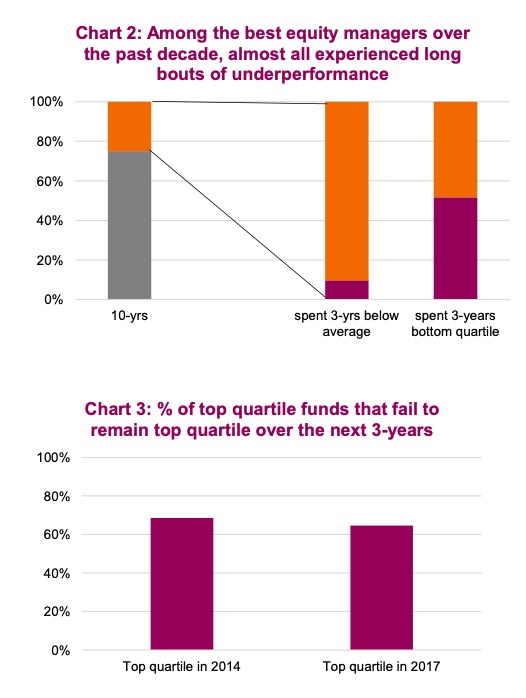
We looked at the best managers over the past 10 years in Canadian equities. These are the ones that have crushed it over a decade of measurement and are in the top position among their peers. But, during that same 10-year period, almost all of them spent a three-year period or longer with below average results. Half spent at least a three-year period in the bottom quartile. If you are prone to chasing performance, you would likely have bailed on these managers when they were underperforming.

Alternatively, we looked at Canadian equity funds that were in the top quartile in June 2014 based on their three-year trailing performance (June 2011 – June 2014). Some 69% of these funds were not positioned in the top quartile in the next three- year period (June 2014-June 2017) – 44 % were actually below average. Similarly, 65% of the top-quartile funds in June 2017 were not top quartile during the next three-year period (2017-2020). See Chart 3.
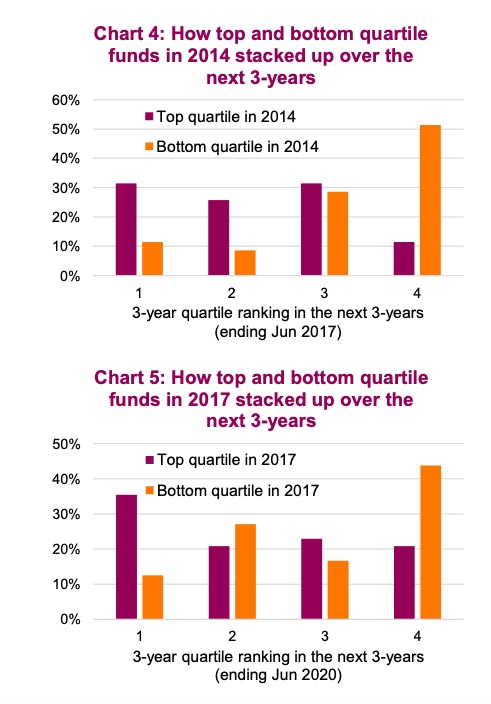
We are not implying that anyone should ignore past performance when considering an investment. As the managers of two Purpose funds that are solidly in the top quartile ranking over the past three years, well, we don’t mind investors looking at past performance. And there has been a higher likelihood that a top-quartile fund will do better over the next three years than a bottom-quartile fund. Charts 4 and 5 contrast the quartile rankings of top and bottom-quartile funds over the next three- year periods. Top-quartile funds appear tilted more towards doing better in the next three years compared to bottom-quartile funds.

So, it’s fine to look at performance, but don’t make it the dominant consideration. Consider what has been working in the market environment – value, growth, momentum, quality, leverage, size, as this changes over time. Blindly chasing what has worked over the past few years is not a recipe for long -term investing success.
Source: All charts are sourced to Bloomberg L.P. and Richardson GMP unless otherwise stated.
Twitter: @ConnectedWealth
Any opinions expressed herein are solely those of the authors, and do not in any way represent the views or opinions of any other person or entity.


