On Monday, I laid out as to why the iShares 20+ Year Treasury Bond ETF (TLT), may be stuck in limbo in the near-term between its 50- and 200-day moving averages and why the latter is likely to act as resistance.
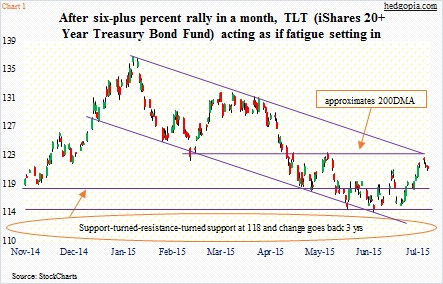
Nothing much has changed since then, except the ETF is showing signs of fatigue (see chart 1 below). And this type of action often opens the door for an options trading strategy.
Let’s recap: As of Monday’s intra-day high of $122.29, TLT rose 6.7 percent in a month. That high was also the closest it has come since late May to test the 200-day moving average ($123.25); the average was also tested early that month. On both occasions, it met with failure.
On a daily chart, TLT’s momentum oscillators are overbought, and this seems to be having more impact right now than macro data. So perhaps an options trading strategy that can capture some of that downside potential near-term would work. More on that later.
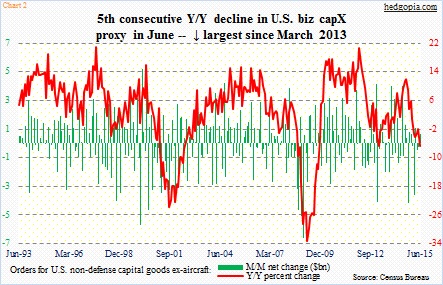
So far this week, major economic data have more or less disappointed. June orders for non-defense capital goods ex-aircraft were up month-over-month but the year-over-year trend is decidedly lower, down 6.6 percent in June and down for five straight months (Chart 2).
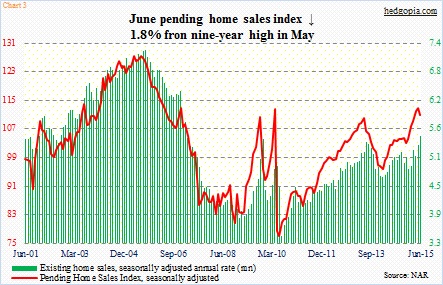
Yesterday, the pending home sales index came out, showing a drop of 1.8 percent in June after a nine-year high in May. Pending home sales are based on signed contracts for existing homes, and tends to lead sales of existing homes by a month or two. The latter reached the highest in June since February 2007. New home sales were a disappointment in June. Looking at pending home sales, existing home sales are probably set to weaken in the months ahead (see chart 3 below). TLT, however, was not able to rally on this.
Right after the release of the FOMC statement yesterday, TLT ($120.74) traded confused, with the five-minute candle swinging between $120.44 and $120.93. The FOMC meets on September 16-17 next, with a press conference scheduled by the Chair. If they were going to move in that meeting, one would think they would drop a stronger clue to that effect. On the other hand, the statement also said this: “The Committee anticipates that it will be appropriate to raise the target range for the federal funds rate when it has seen some further improvement in the labor market and is reasonably confident that inflation will move back to its 2 percent objective over the medium term.”
Feel free to dissect the word “some” whichever way you like. The next two jobs reports (August and September) hold the key, then? If so, the recent trend in non-farm jobs leaves a lot to be desired. Two of the past four months have produced sub-200,000 jobs, and in the past two months the six-month average has crossed below the 12-month average. Momentum is waning.
The July jobs report will be reported next week, on August 7. As far as employment-related numbers are concerned, there is a vacuum between now and next Friday – a perfect setting for TLT to unwind its daily overbought conditions.
In this scenario, a synthetic short position can be created using options trading. Hypothetically, August 7th 120.50 calls are selling for $1.06 and puts of the same strike and expiration for $1.10. A short call and a long put can be combined with options trading to essentially create a synthetic short for a $0.04 debit. If, as expected, TLT comes under pressure in the next seven sessions, the gain is essentially free of cost. This is not without risk, though. If the ETF manages to rally past the strike, there is no cushion, as the premium earned from the short call is used in funding the purchase of the put.
On the other hand, a naked call write – though risky, no doubt – will have some cushion. Just to be safe, August 7th 121 calls fetch $0.83. It is naked, so will effectively go short at $121.83 should TLT rally.
Thanks for reading.
Twitter: @hedgopia
No position in any of the mentioned securities at the time of publication. Any opinions expressed herein are solely those of the author, and do not in any way represent the views or opinions of any other person or entity.


