On April 17th, Honeywell International (HON) reported Q1 earnings per share of $1.41 vs the Wall Street consensus estimate of $1.39 on revenue of $9.21B vs the $9.50B estimate. This was down 4.8% year over year, but the $83B industrial conglomerate saw margins tick higher by 220 basis points to 18.7%.
Honeywell pays a nice dividend of just under 2 percent. Also notable is that CEO David Cote has said that they plan on spending around $10 Billion on mergers & acquisitions by 2018. With nearly $9 Billion in cash and short-term investments I am expecting a couple of deals later this year as the overall M&A market has been heating up.
Honeywell stock trades at a Price to Earnings (P/E) ratio of 17.5 (using 2015 estimates), price to sales ratio of 2.05, and a price to book ratio of 4.65. On April 28th, Oppenheimer reiterated their outperform rating with a price target of $117/share.
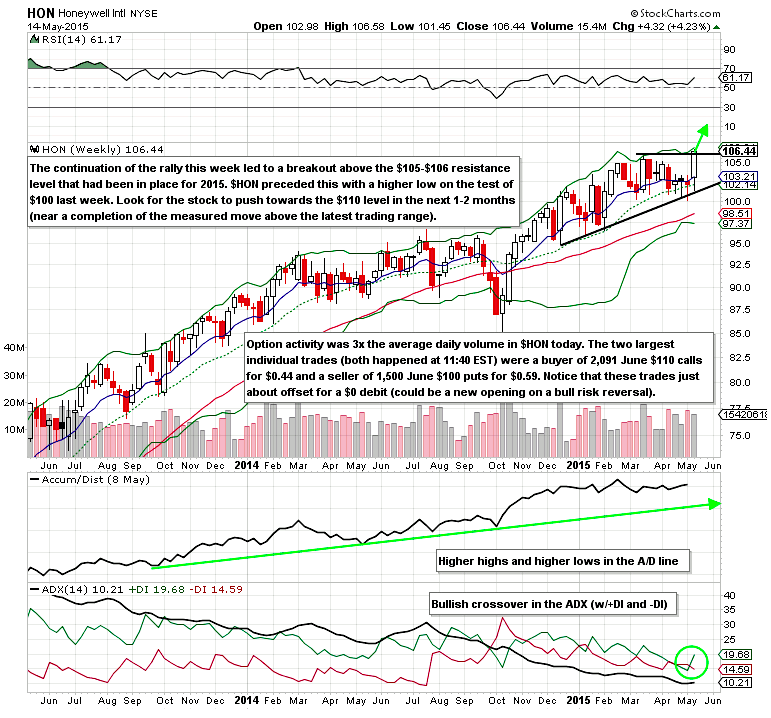
Honeywell Stock Chart – Is a breakout in the works?
Options Trade Ideas – Honeywell International (HON)
These are simply ideas that I am looking at. As with any trade they involve risk and traders need to create a plan to manage the risk.
- Buy the (HON) June $105/$110 bull call spread for a $2.05 debit or better
This would include buying the June $105 call and selling the June $110 call, all in one trade
Stop loss- None
1st upside target- $4.00
2nd upside target- $4.95
Or
- Buy the (HON) June $105/$110/$115 call butterfly for a $1.65 debit or better
This would include buying 1 June $105 call, selling 2 June $110 calls, buying 1 June $115 call, all in one trade
Stop loss- None
1st upside target- $3.30 or a move to $110 in the stock
2nd upside target- $4.90
Follow Mitchell on Twitter: @MitchellKWarren
Read more from Mitchell on his blog.
No position in any of the securities mentioned at the time of publication. Any opinions expressed herein are solely those of the author, and do not in any way represent the views or opinions of any other person or entity.


