 As we enter October and the final quarter of the year, I thought it would be fun to highlight October stock market performance through some memorable market snapshots. It’s almost a right of passage for active investors to “tour” the hallowed halls of October and feel its rich history of market volatility.
Despite the stock market crashes of 1929 and 1987, October stock market performance has been historically positive. So, although we have seen great volatility and memorable market crashes (and rallies), the month has been on par with other months. That said, it’s been a mad house for active investors, making or breaking many traders’ years.
From the 1987 Stock Market Crash to the 1997 Asian Contagion to the 2002 Tech Bottom to the 2008 Stock Market Crash and more, it’s been a month of wild market swings.
October Stock Market Performance – In Pictures
Okay, this wouldn’t be fun if we didn’t get right to the meat of the more memorable October stock market charts (of recent history). Enjoy!
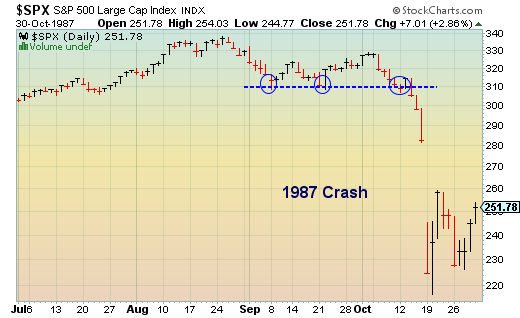
October 1987 Stock Market Crash
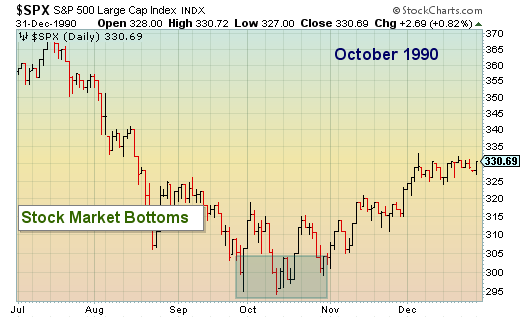
October 1990 Stock Market Bottom
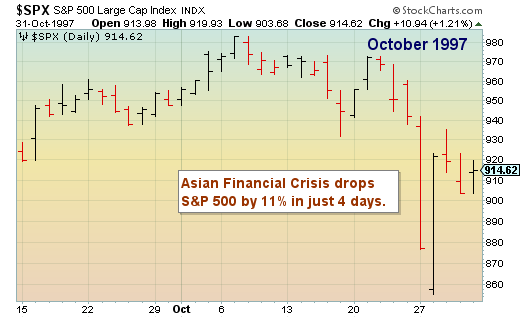
October 1997 Asian Contagion Stock Market Crash
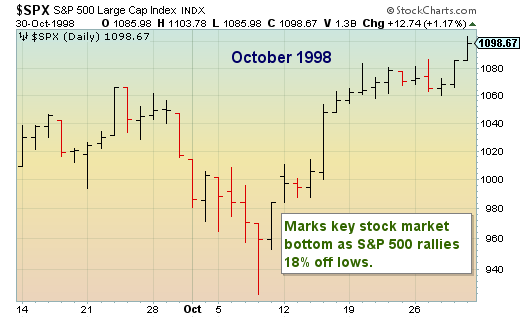
October 1998 Stock Market Rally
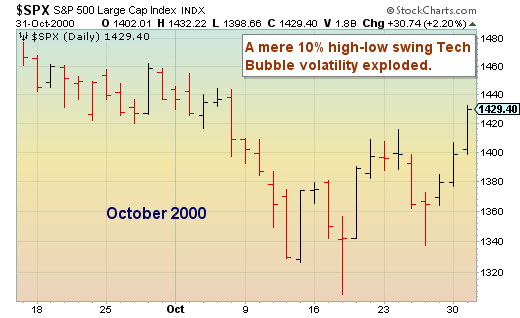
October 2000 Tech Bubble Volatility
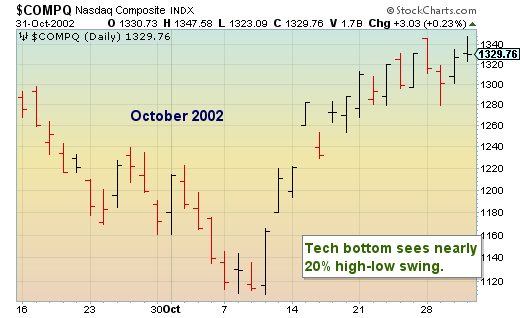
 October 2002 Tech Bubble bottom
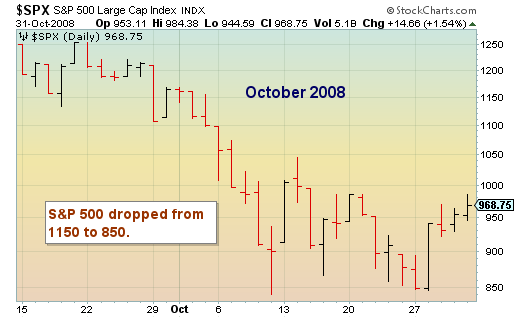
October 2008 Stock Market Crash – (following Lehman Brothers Sept 15 2008 bankruptcy filing)
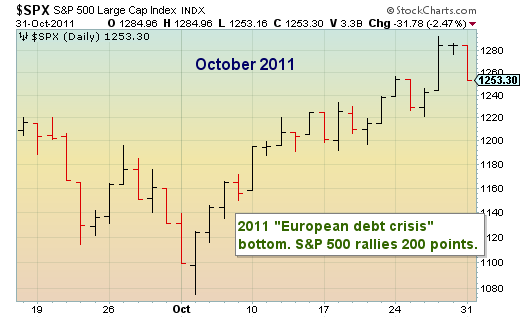
October 2011 Stock Market Bottom and Rally
Thanks for reading. Trade safe.
Twitter: @andrewnyquist @seeitmarket
No position in any of the mentioned securities at the time of publication. Any opinions expressed herein are solely those of the author, and do not in any way represent the views or opinions of any other person or entity.

