One of the most watched, yet misunderstood, pieces of investing research is NYSE Margin Debt. Hitting new highs or all-time highs gets a lot of buzz… and bears point to it as a sign of an impending market top.
But it’s been making new highs for months now. And it’s typically bearish unless it’s confirmed by other slices of data. More on that below.
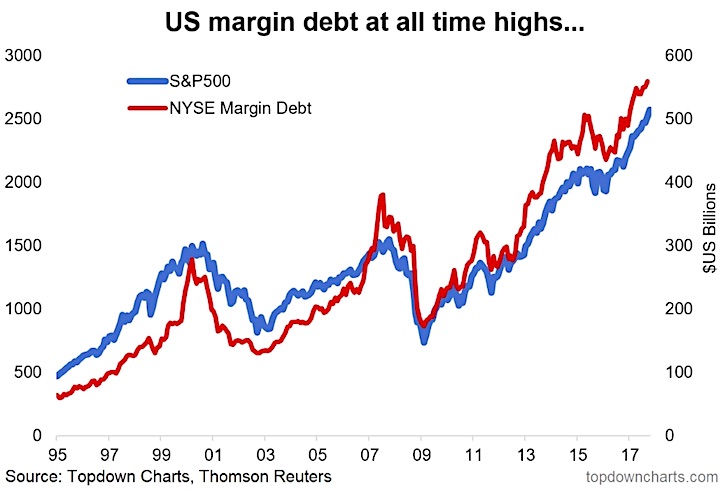
First, let’s do a quick recap… The latest NYSE margin debt data was released last week, with data through September. Margin debt is at all-time highs (mirroring the stock market). Margin debt is a good reading for risk appetite and sentiment… two items running hot right now. (see my recent piece on investor euphoria.
You can see a long-term chart of NYSE margin debt vs the S&P 500 Index (INDEXSP:.INX) below… and how both are making all-time highs currently.
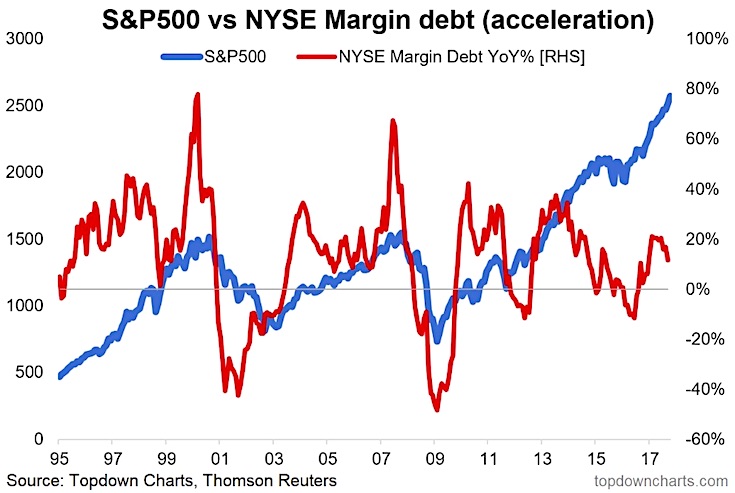
So what’s not to like? Well, there’s one piece of cautionary data, and it looks at the annual percent change in margin debt (highlights acceleration). This can be a concern if margin debt spikes and is followed by a deceleration. Worth watching right now. See chart below.
Twitter: @Callum_Thomas
Any opinions expressed herein are solely those of the author, and do not in any way represent the views or opinions of any other person or entity.


