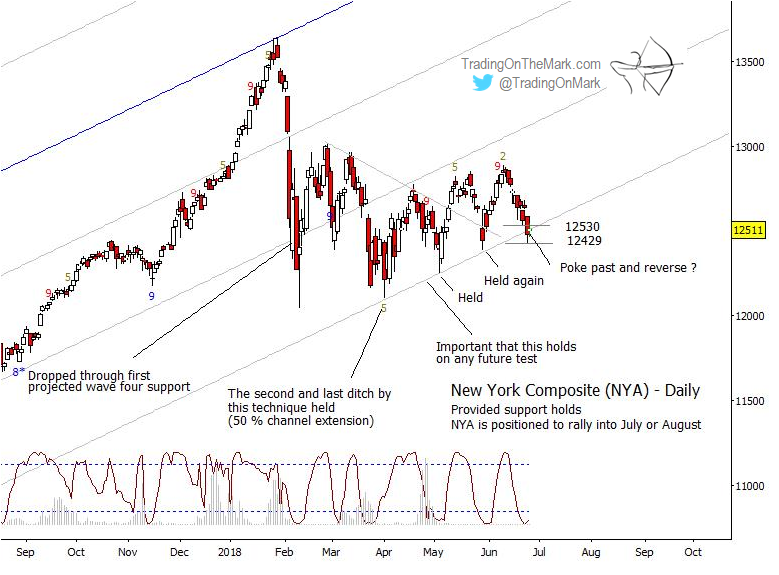
The broad NYSE Composite Index (NYSE Arca: NYA) has put in a series of higher lows since we last updated our bullish forecast in May.
Now it is testing support again, and the relevant price cycle suggests it can rally into mid-July or longer. And Elliott wave analysis thus far agrees as well.
Even though the pattern has been choppy, the index achieved the expected breakout above the descending trend line that had constrained it since February. Subsequent tests of the supporting channel harmonic were brief and produced strong bounces.
If current support holds, the pattern should be viewed as an upward escape from a contracting range that may have been an Elliott fourth wave.
Over on our website we have been following similar patterns in the S&P 500, the Russell 2000, and the DJIA indices.
A support zone extends as low as 12428 based on Fibonacci relationships among the recent waves, and that allows for a brief poke beneath the channel harmonic without ringing alarm bells. Meanwhile the cycle derived by the Lomb periodogram, shown at the base of the chart, suggests the current area should be viewed as a low preceding an advance that should last several weeks if not longer.
NYSE Composite (NYA) Chart
If this chart fits the time frame that you like to trade, we encourage you to take a look at the special subscription plan we’re making available right now. Take out an annual subscription (charts every trading day for a wide range of markets), and we’ll deduct the cost of three months of service. Basically you get a whole summer of charts for free! The coupon code to take advantage of this offer is “summer”.
TOTM’s Daily Analysis includes charts every trading day for the S&P 500, crude oil, the Euro and Dollar Index, treasury bonds, and gold.
Twitter: @TradingOnMark
The authors may have a position in the mentioned securities at the time of publication. Any opinions expressed herein are solely those of the author, and do not in any way represent the views or opinions of any other person or entity.


