On May 12, I looked at the S&P 500 and explained why stock market weakness shouldn’t surprise investors here.
Momentum stalled out into May. Divergences were flashing caution and the Russell 2000 and Dow Jones Industrial Average had not made new highs (vs the S&P 500 and NASDAQ new highs).
I forgot another important broad index: the NYSE Composite.
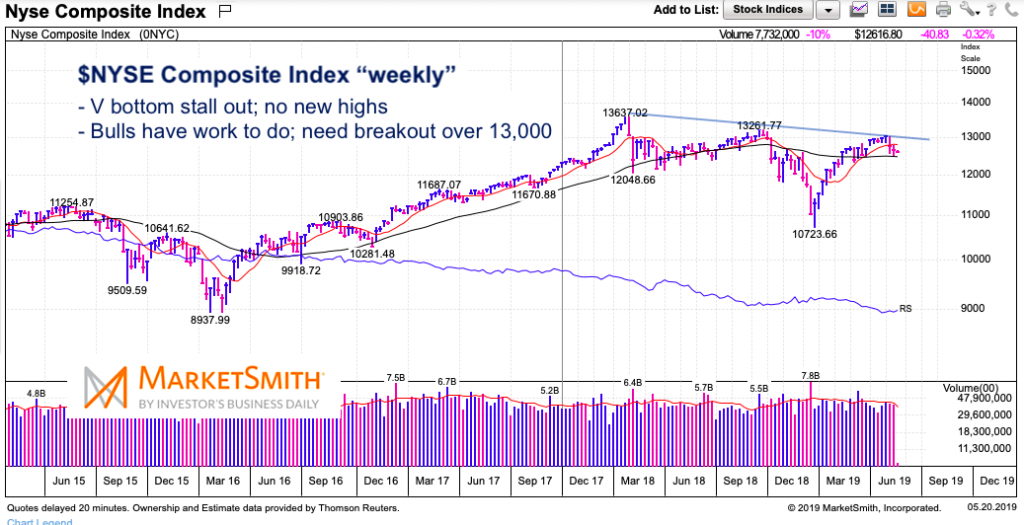
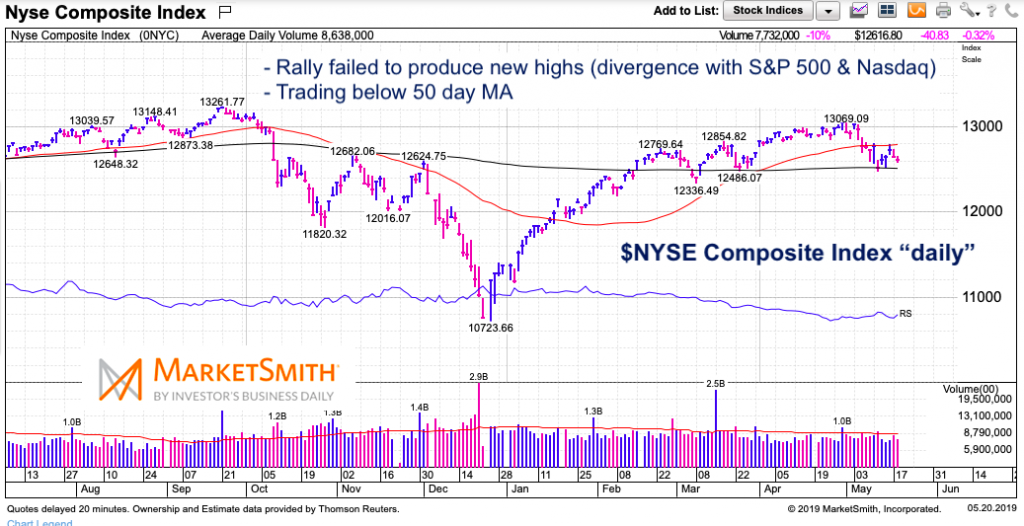
This index too has failed to make new all-time highs during the 2019 rally. In my opinion, the market is in a broad consolidation phase and its a stock pickers market. We’re seeing “defensive” sectors outperform, along with pockets of beta and blue chips. Signals are messy, the price action is choppy, and investors need patience. Below are daily and weekly charts of the NYSE Composite along with some thoughts.
Note that the following MarketSmith charts are built with Investors Business Daily’s product suite.
I am an Investors Business Daily (IBD) partner and promote the use of their products. The entire platform offers a good mix of technical and fundamental data and education.
NYSE Composite “weekly” Chart
The weekly chart is a great illustration of the sluggishness that’s overcome the market since we turned the past from April to May. The NYSE failed to make new highs and needs more time to consolidate and construct. Bulls have work to do (on a number of indices), but await a strong breakout over 13,000 on the NYSE.

NYSE Composite “daily” Chart
The NYSE needs to regain its 50 day moving average. As well, the 200 day moving average is flattening but needs more time to turn higher. The 200 day MA resides in an important lateral price support zone that investors should keep an eye on: 12,400 to 12,600.

Twitter: @andrewnyquist
The author has a position in mentioned securities at the time of publication. Any opinions expressed herein are solely those of the author, and do not in any way represent the views or opinions of any other person or entity.


