It is imperative for active investors to understand the importance of market leadership, both on the way up and down.
And this is proving to be very true of the Semiconductors sector. The Semis played a HUGE role in the tech bull market, helping to push the Nasdaq and Nasdaq 100 higher and higher over more than a decade.
But, as we have covered several times this year (click here for our latest article on Semis), tech turned lower late last year… and the Semis were the warning as a leader to the downside.
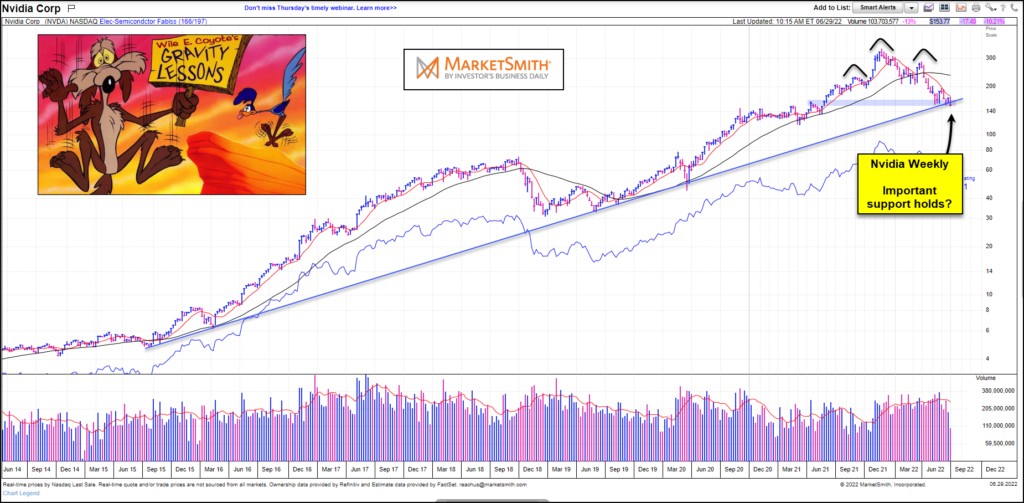
So today we look at a “weekly” chart of one of the bigger Semiconductor companies in the arena – Nvidia (NVDA).
As you can see, a bearish head and shoulders pattern has lead to a steep decline. NVDA is now testing important dual support (long term up-trend line and lateral support.
This feels like an important support test for semi-leadership… and the market as a whole. Stay tuned!
$NVDA Nvidia “weekly” Stock Price Chart

Note that KimbleCharting is offering a 2 week Free trial to See It Market readers. Just send me an email to services@kimblechartingsolutions.com for details to get set up.
Twitter: @KimbleCharting
Any opinions expressed herein are solely those of the author, and do not in any way represent the views or opinions of any other person or entity.


