Gaming has been a hot sector for the past decade plus. And each of the gaming console stocks tends to go through cycles and garner buzz into their latest release.
One stock that caught my eye recently (and somewhat randomly) is Nintendo, stock ticker NTDOY.
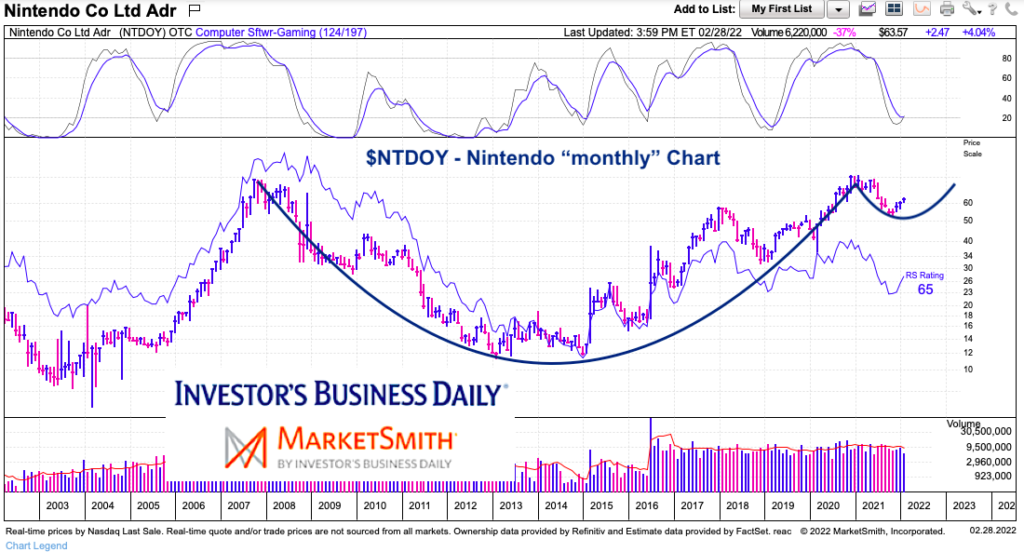
In general, the stock has struggled over the past year, so I pulled up the longer-term “weekly” and “monthly” charts. What caught my eye was amidst the price swings (which there are a lot), was the “basing” periods. This stock loves to consolidate and build a base to emerge from… at least that’s the M.O. over the past 8-10 years.
So today, I share a simple long-term “monthly” chart and let it (mostly) speak for itself.
Note that the following MarketSmith charts are built with Investors Business Daily’s product suite.
I am an Investors Business Daily (IBD) partner and promote the use of their products. The entire platform offers a good mix of analysts, education, and technical and fundamental data.
Nintendo “monthly” Stock Chart
As you can see, Nintendo built a massive 13 year “cup” base. The stock has struggled over the past year but could be building a “handle” or bullish consolidation. Momentum is curling higher which is interesting over a shorter-term duration… however, this could take several more months and additional backing and filling before complete. At any rate, this is an interesting chart with a longer-term tilt.

Twitter: @andrewnyquist
The author has a trading position in mentioned securities or similar at the time of publication. Any opinions expressed herein are solely those of the author, and do not in any way represent the views or opinions of any other person or entity.


