 It’s no secret that the much-maligned precious metals complex, belly-to-long end of the US Treasury yield curve and the carry trade-funding Japanese Yen have all been hammered into dust lately. There’s a complex set of macro variables contributing to the under performance of these and other generically “risk-off” asset classes – some shared, and some different; but one thing is clear: today, they all like the “anemic” NFP print published by the BLS at 0830am ET today. Equities are broadly flat, showing little concern; but is the signal of NFP risk off?
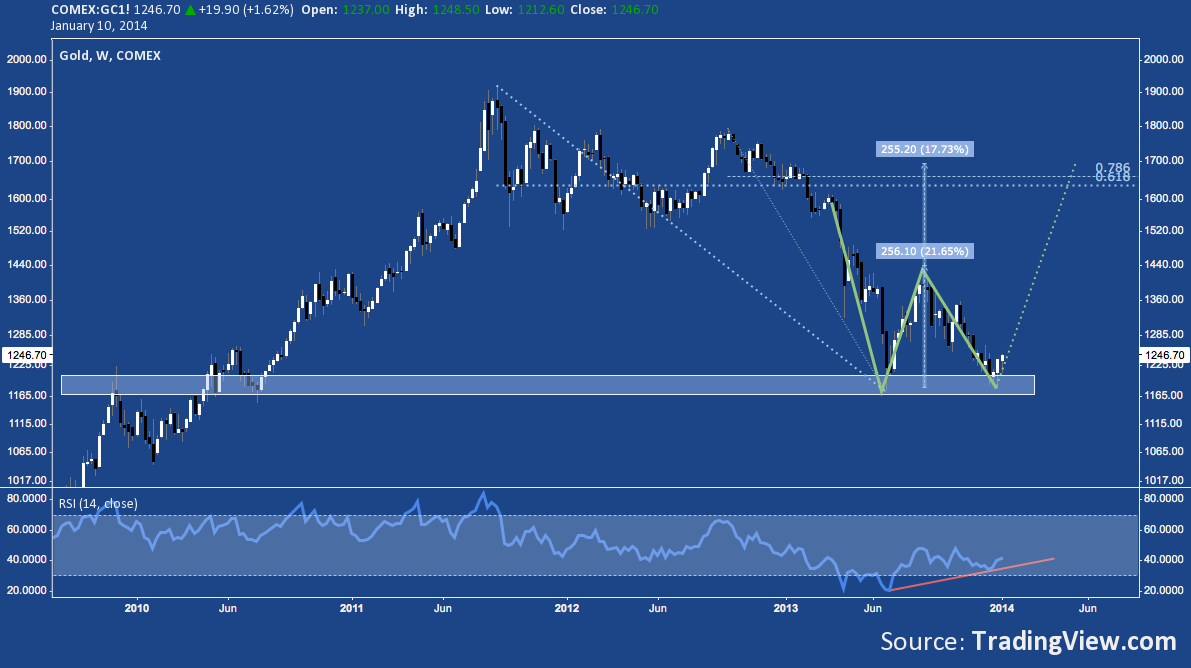
Gold is closing green for the third week in a row, continuing last week’s solid followthrough from the 1180-1225 fulcrum point first visited in November/December 2009 from underneath. It’s quite early and wouldn’t confirm until over $1450, but it may be time to begin contemplating a medium-term double bottom.
Gold (GC) – Weekly: Bouncing At Horizontal Support, Potential Double Bottom
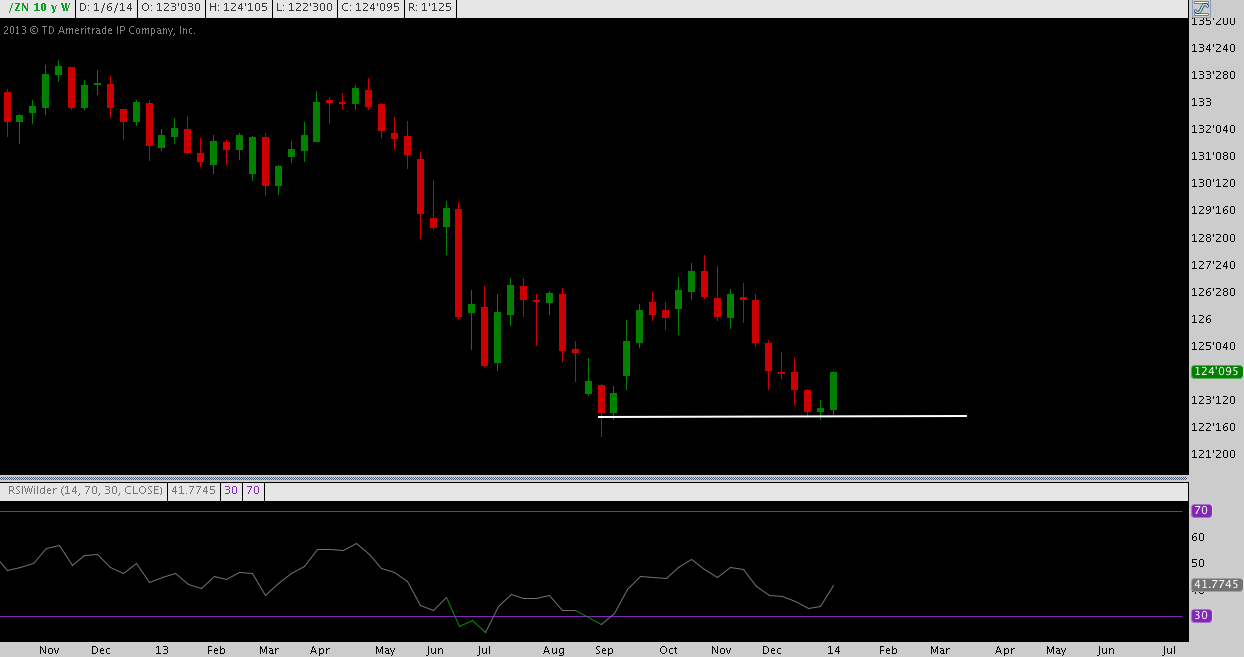
Similarly, the 10-year benchmark US Treasury Note found support at the same level for the third consecutive week near 123, recalling late August 2013’s bounce from the same level. These 3 weeks have built out a Three Inside Up candlestick pattern that highly resembles a morning star pattern – either interpretation, especially at major horizontal support (check) and on a positive momentum divergence (check) looks constructive for higher prices in the short-term. Also, the possibility of a double bottom (like gold) can’t be overlooked.
10-Year US Treasury Note (ZN) – Weekly: Three Inside Up At Horizontal Support
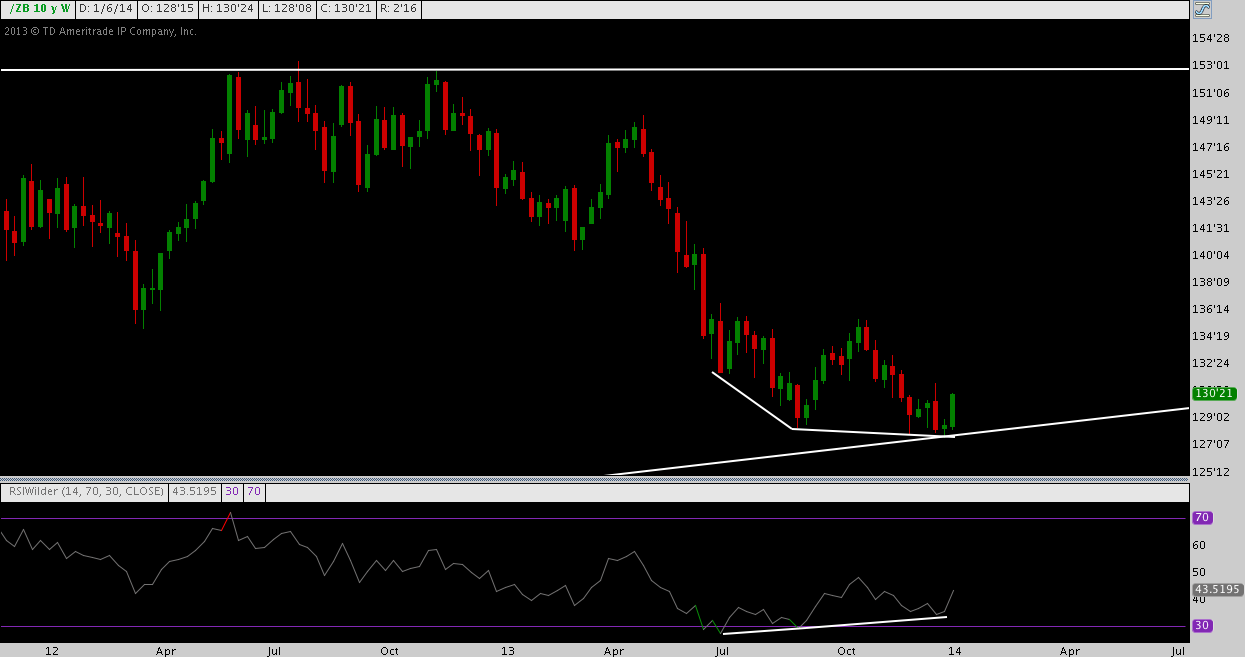
Scanning over to the long end of the yield curve, the 30-Year US Treasury Bond has a very similar story: horizontal support (here at 128), a Morning Star-like Three Inside Up candlestick pattern and positive momentum divergence are each present; and don’t forget the possible medium-term double bottom (a recurrent theme is emerging here). In addition, the 30y is at cyclical trend line support as well. With the intermediate trend down but long-term trend up, the outlook here shifts from bearish to neutral/bullish as long as this 127-129 level holds out.
30-Year US Treasury Bond (ZB) – Weekly: Three Inside Up at Horizontal Support
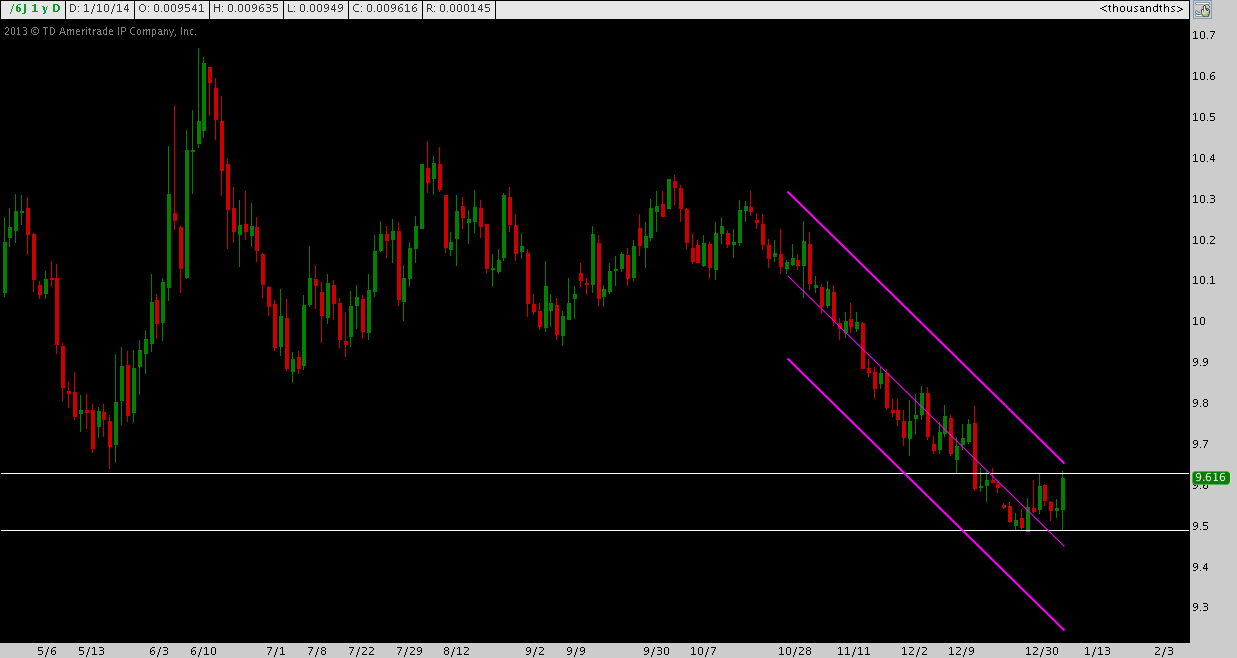
And then there’s the Japanese Yen. Beleaguered, abased and otherwise loathed (except by commercial hedgers!), the JPY has been the consummate falling knife over the past 3 months. The Yen’s trend is firmly down; but horizontal support at 9.5 has emerged, and with today’s pop the currency is testing the top of its 3-month regression channel and 9.6 resistance. Note that 9.6 served as support for May 2013’s swing low. Looking for even short-term pop here is still presumptuous on technical grounds, but above the May low (9.64) with a higher high in the context of the last 3 months and a major short-covering rally may catch fire.
Japanese Yen (J6) – Daily – Finding at Foothold at 9.5, Resistance at 9.6 (for now)
Twitter: @andrewunknown and @seeitmarket
Author holds no exposure to asset classes mentioned at the time of publication.
Any opinions expressed herein are solely those of the author, and do not in any way represent the views or opinions of any other person or entity.


