Long-dated U.S. treasury bonds have moved higher recently but the trend remains down.
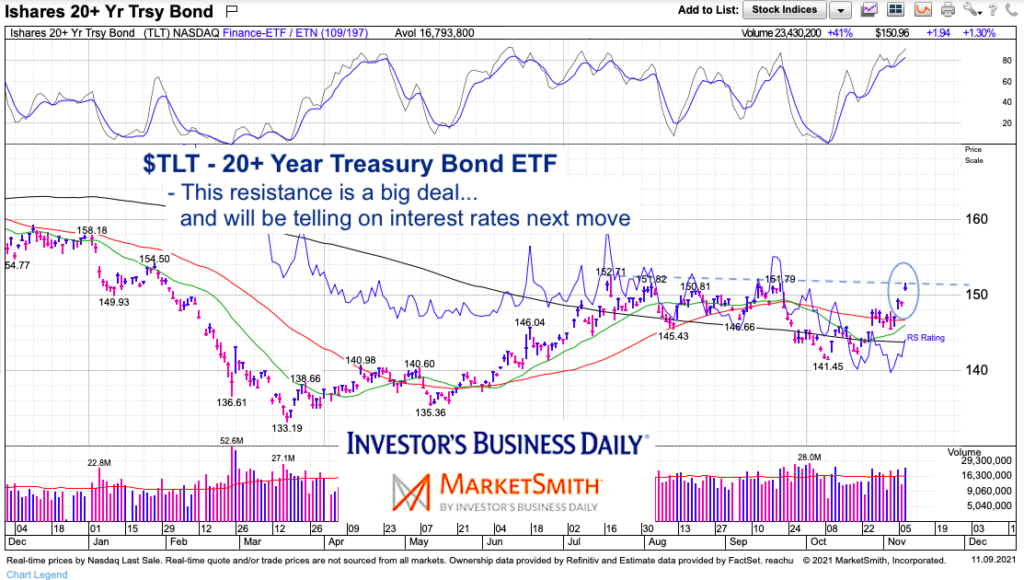
The rally has brought the 20+ Year US Treasury Bond ETF (TLT) to an important price resistance area. And either TLT will break out and confirm another leg higher… or it will reverse lower and potentially make new lows.
As many of you know, my philosophy on sharing charts is to keep it simple. It’s like texting versus talking live… I don’t need to confuse the macro price message of a chart by making it too complex to understand. Often, this means pointing out price areas of consequence (support/resistance). Let’s look at the chart.
Note that the following MarketSmith charts are built with Investors Business Daily’s product suite.
I am an Investors Business Daily (IBD) partner and promote the use of their products. The entire platform offers a good mix of analysts, education, and technical and fundamental data.
20+ Year US Treasury Bond “daily” Chart
This is a daily chart so it is more short-to-intermediate term in nature. As inflation is heavy in the news (and weighing on investors and consumers minds), the direction of interest rates is front and center. When bonds move higher, rates go lower. When bonds move lower, rates move higher. As mentioned TLT has been in a down-trend.
As you can see on the chart, TLT is testing an important resistance zone. If bonds are going to move higher, TLT will need to breakout above the July high. This would mean lower interest rates. Failure here, would offer up the potential for higher rates. A move either way carries implications for all assets. This is an important chart to watch.

Twitter: @andrewnyquist
The author may have a position in mentioned securities at the time of publication. Any opinions expressed herein are solely those of the author, and do not in any way represent the views or opinions of any other person or entity.


