After a big summer rally, Gold peaked out at $1566/oz in September.
Since then, Gold prices have been consolidating between $1475 and $1550.
So what’s happening here? Enter the Swiss Franc currency…
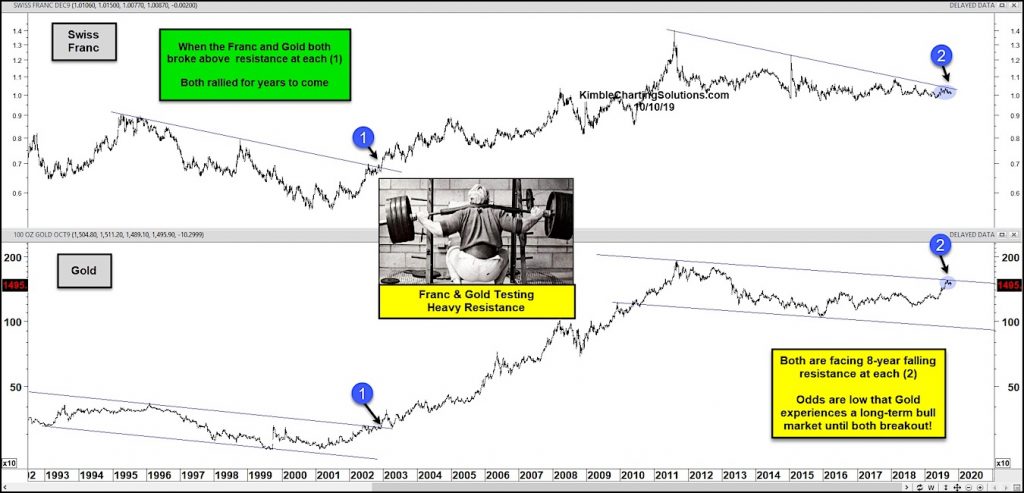
In today’s chart, we look at a key indicator (and correlation) for Gold. As you can see, the Swiss Franc has an uncanny resemblance to Gold.
Both Gold and the Franc are testing heavy resistance at the same time.
Until both breakout at (2), odds are low that a new Gold bull market emerges with another big rally leg higher.
Looking back, it wasn’t until both Gold and the France broke out above price resistance at each (1) that a new Gold bull market emerged. Can it happen again? Stay tuned!
Swiss Franc Currency and Gold Long-Term Price Charts

Note that KimbleCharting is offering a 2 week Free trial to See It Market readers. Just send me an email to services@kimblechartingsolutions.com for details to get set up.
Twitter: @KimbleCharting
Any opinions expressed herein are solely those of the author, and do not in any way represent the views or opinions of any other person or entity.


