The Nasdaq and its contingent of tech stocks are not doing so well right now.
The strongest stocks and sectors are sometimes the last to fall. Today we’ll look at Netflix (NFLX).
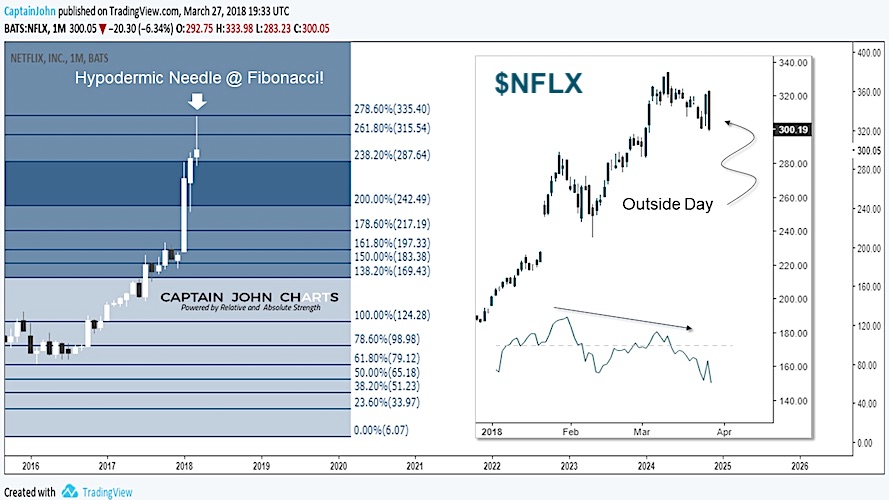
Looking at NFLX Monthly and Daily charts below, there are 3 bearish observations to note:
1. There’s an Inverted Hammer forming on the Monthly chart after tagging the 278.6% Fibonacci Extension
2. Netflix (NFLX) put in a monster “Outside Day” on its Daily chart.
3. There’s an RSI Negative Momentum Divergence.
These observations are not exclusive to Netflix – they are everywhere in Nasdaq land! Careful.
If you are interested in learning more about our investing approach and financial services, check out Captain John Charts.
Twitter: @CptJohnCharts & @FortunaEquitis
The author may have a position in mentioned securities at the time of publication. Any opinions expressed herein are solely those of the author, and do not in any way represent the views or opinions of any other person or entity.


