Tech stocks have enjoyed a strong run during the first quarter of 2023. Will it continue? Or is this just a dead cat bounce?
Unsure, but we can still pick winners and losers by eyeing the performance of the tech indices while looking at stocks that are out-performing or under-performing
Currently, tech is leading and we want to be long the winners (out-performers) and short or ignore the lowers under-performers). If tech begins to show weakness… again, we are long the out-performers.
That said, today we take a peak at a recent stock that has been showing strength — Netflix (NFLX). But instead of simply following its recent strength, I take a look at it on multiple time frames as a means of gathering perspective.
Note that the following MarketSmith charts are built with Investors Business Daily’s product suite.
I am an Investors Business Daily (IBD) partner and promote the use of their products. The entire platform offers a good mix of tools, education, and technical and fundamental data.
$NFLX Netflix “daily” Stock Chart
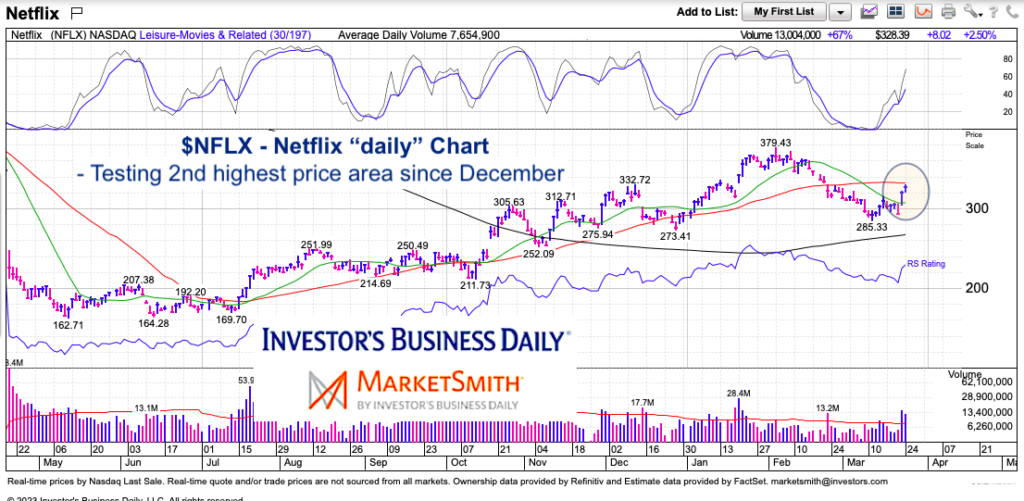
The near-term prospect is showing strength, especically of late. It’s currently trading near its december high and just under its 50-day moving average. A move over this level would be bullish. Momentum is rising (good). So far so good but we’ll have to watch that 50-day ma.

$NFLX Netflix “weekly” Stock Chart
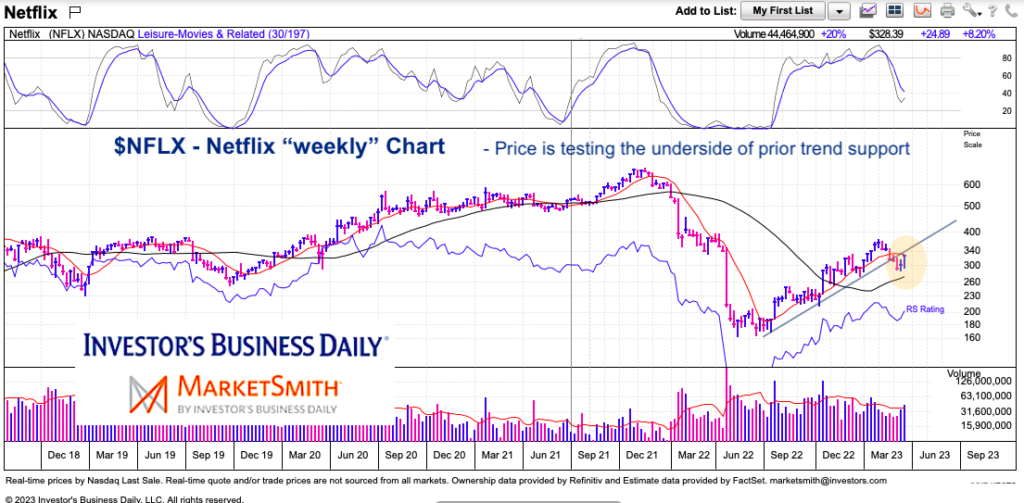
Turning to the intermediate-term weekly chart, we can see that price broke down through its up-trend at the beginning of the year. And only more recently has NFLX began to show strength. It is now $10-$15 below its prior uptrend line. Decisively breaking above this line (say, a close over $350) would give the bulls a boost.

Twitter: @andrewnyquist
The author may have a position in mentioned securities at the time of publication. Any opinions expressed herein are solely those of the author, and do not in any way represent the views or opinions of any other person or entity.


