Prices are rising across several commodities… oil, gold, corn, soybeans, wheat, lumber. And this has economists and investors beginning to eye inflation.
I agree, inflation is here and will linger for some time. Complacency due to elevated equities prices is creating an atmosphere that is ripe for surprise.
What do you mean by “surprise”? Many times the obvious gets overlooked because of complacency (i.e. it isn’t different this time).
Today, we look at another commodity: Natural Gas (via the Natural Gas ETF – $UNG). And why a short-term (daily) and intermediate term (weekly) base may be pointing to higher prices ahead. And a confirmation of inflation across the U.S. financial markets.
Note that the following MarketSmith charts are built with Investors Business Daily’s product suite.
I am an Investors Business Daily (IBD) partner and promote the use of their products. The entire platform offers a good mix of technical and fundamental data and education.
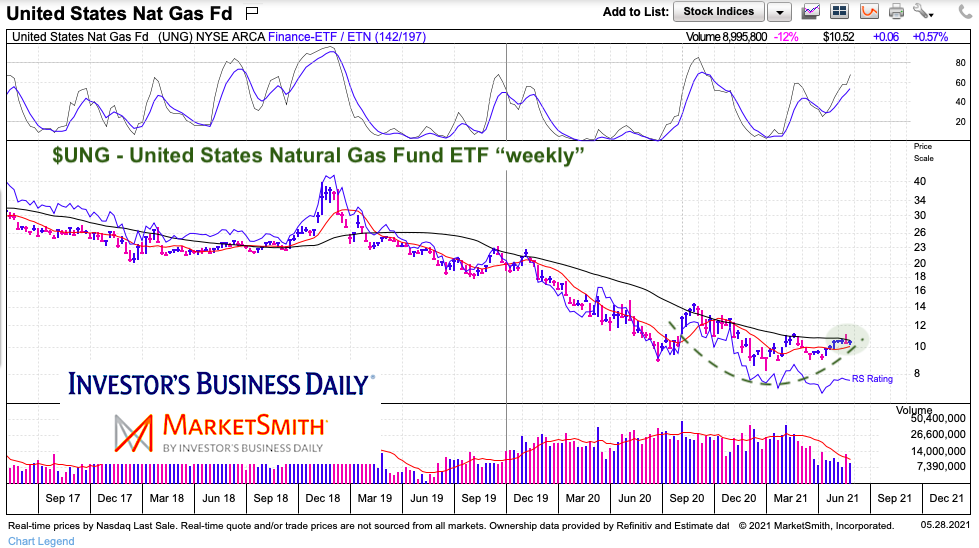
$UNG United States Natural Gas Fund ETF “weekly” Chart
After years of falling prices, a strong base is forming on the longer-term chart of Natural Gas. Patience is required as the 10 and 50 week moving averages are flattening and attempting to move higher. It may take some time, but should they move higher it would mean a major reversal for natural gas.
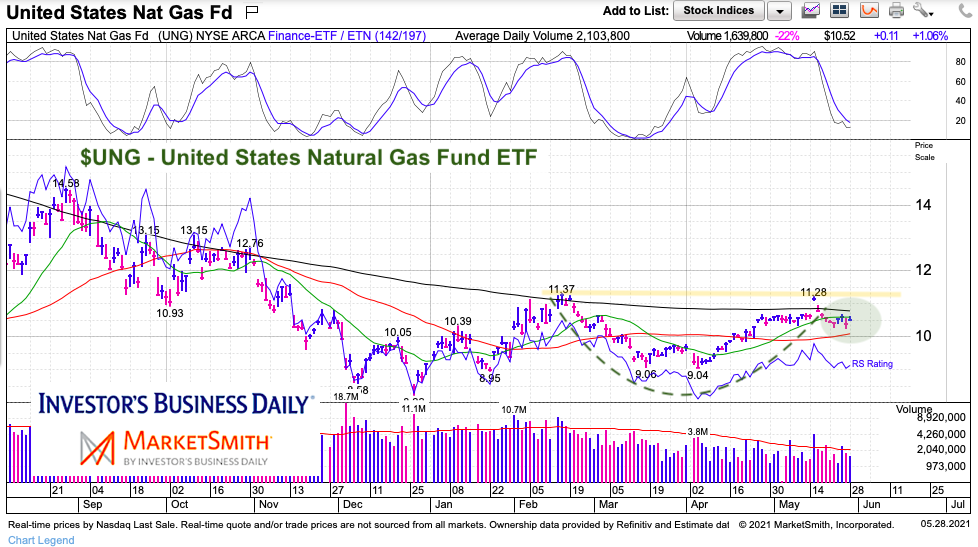
$UNG United States Natural Gas Fund ETF “daily” Chart
When we zoom in, we can see that the natural gas ETF ($UNG) has formed another cup-like (base) formation on the “daily” chart. Again, the moving averages are flattening and any buying pressure could reverse the trend. Watch the February and May highs (11.28-11.37). A breakout over that area would be bullish for batural gas prices and likely confirm a worrisome trend of higher commodity prices.
Twitter: @andrewnyquist
The author may have a position in mentioned securities at the time of publication. Any opinions expressed herein are solely those of the author, and do not in any way represent the views or opinions of any other person or entity.

