STATUS OF THE NASDAQ’S LONG-TERM BREAKOUT
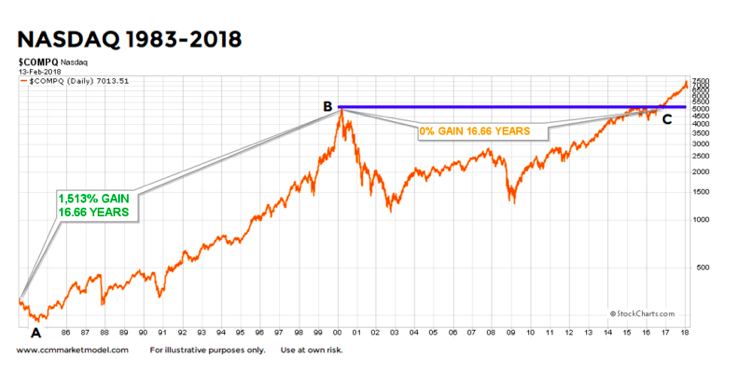
Between points A and B in the chart below, the tech-heavy NASDAQ experienced numerous bouts of emotionally-draining volatility. The same A to B period featured a secular trend that lasted 16.66 years and posted a hard-to-comprehend 1,513% gain.
Since the latter stages of the 16.66 year move checked every “this looks like a bubble” box, it is not surprising the market had to consolidate its gains, which is exactly what happened over the next 16.66 years. Between points B and C, the NASDAQ went absolutely, positively nowhere before breaking out of the massive and multiple-year consolidation box in late 2016 (above point C).
NASDAQ LONG TERM OUTLOOK: THE LONGER A MARKET GOES SIDEWAYS…
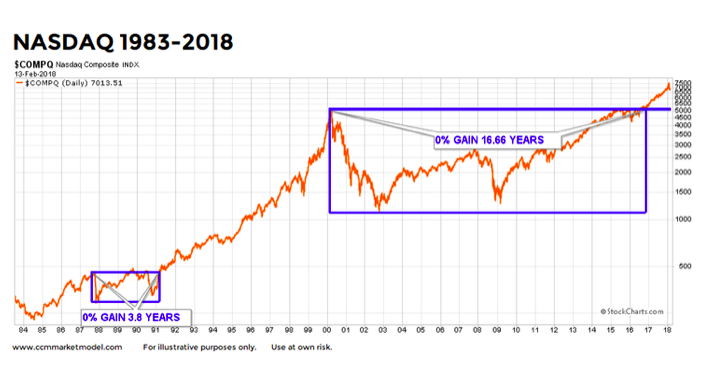
Regular viewers of CCM’s weekly videos are familiar with the expression, the longer a market goes sideways, the bigger the move we can expect to get after either a bullish breakout or bearish breakdown. Prior to completing the 1991-2000 leg of the secular move, the NASDAQ went sideways for 3.8 years. Prior to breaking out and successfully retesting the breakout in 2016, the NASDAQ went sideways for 16.66 years (see chart below).
MORAL OF THE STORY
The moral of the story is market fractals tell us it is in the realm of possibility the NASDAQ could rally for a period much longer than the human mind can easily comprehend and the magnitude of the gains could be extremely satisfying. If you have studied charts for years, the previous sentence is not really even debatable; it is the message from the present day charts.
PROBABILISTIC STATEMENTS BASED ON FACTS
We are simply making statements about the probability of good things happening relative to the probability of bad things happening over the next 5 to 20 years. If the facts in hand and charts change in a meaningful way, the assessment of the probabilities must be adjusted as well. We will continue to take it day by day, remaining open to all outcomes, from wildly bullish to painfully bearish.
YOU ARE OUT OF YOUR MIND
If we were working on Wall Street in 1990 and called a group of coworkers and clients into a conference room and said…
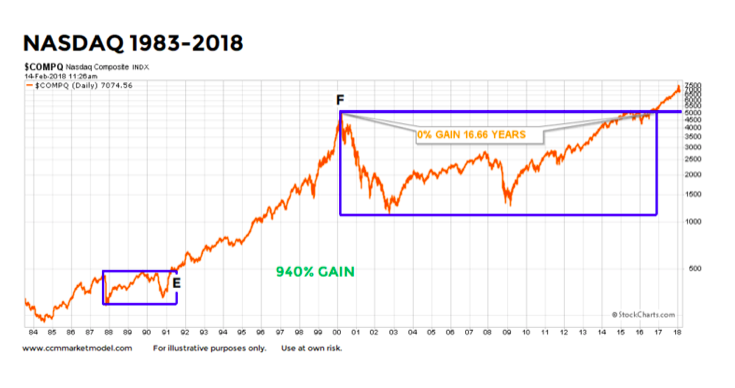
“THE NASDAQ WILL GAIN 940% OVER THE NEXT NINE YEARS”
…you would have been laughed out of the room and told to get some help. And yet, that is exactly what happened between points E and F below. Skepticism is part of the early stages of a secular trend script. We are supposed to be skeptical with chart patterns like the one shown below. It is logical to be skeptical after the NASDAQ disappointed us for 16.66 years.
WHAT ABOUT?
The market considers all topics on all timeframes. Therefore, every single “what about” question is reflected in the charts above.
- What about valuations? Click here
- What about the fact that stocks have gone up for 9 years? Click here
- What about the health of the bull market in light of recent volatility? Click here
Twitter: @CiovaccoCapital
The author or his clients may hold positions in mentioned securities at the time of publication. Any opinions expressed herein are solely those of the author, and do not in any way represent the views or opinions of any other person or entity.


