Tech stocks have been under-performing the broad market by a wide margin. Better said, growth stocks have been under-performing.
In any event, the Nasdaq and Nasdaq 100 have been laggards. More so the Nasdaq 100 and large cap tech stocks.
The big question now: Are tech stocks headed even lower yet this spring?
This weekend we attempt to analyze the “daily” and “weekly” charts of the Nasdaq 100 ETF (QQQ) and provide some current trend insights, as well as some key price support levels to watch (including Fibonacci retracements).
Note that the following MarketSmith charts are built with Investors Business Daily’s product suite.
I am an Investors Business Daily (IBD) partner and promote the use of their products. The entire platform offers a good mix of technical and fundamental data and education.
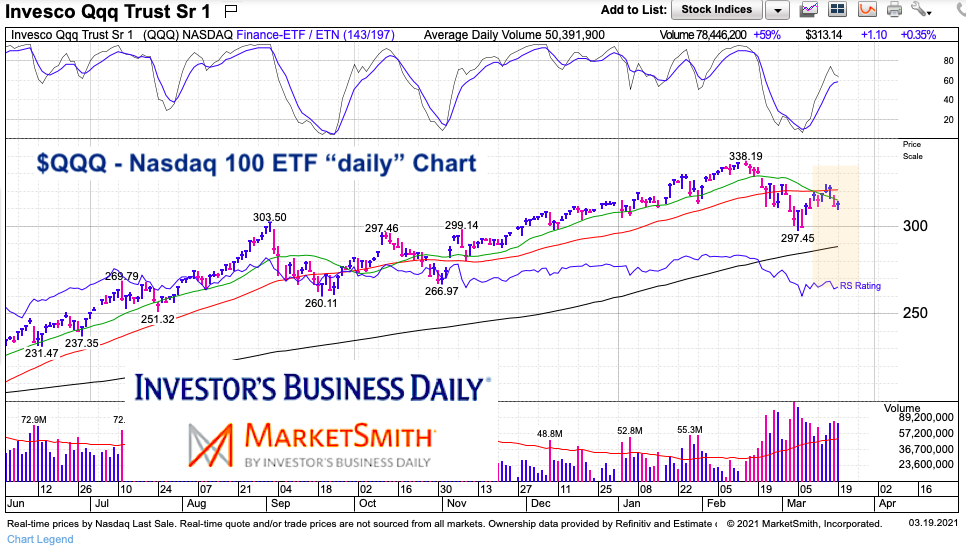
$QQQ – Nasdaq 100 ETF “daily” Chart
We saw a nice recovery rally that appears to follow an A-B-C move lower. However, what if that is just the “A” move and we are now completing the “B” move? If so, then the “C” move could take us down to $280-$285. Note that the 200-day moving average is also nearby around $289.
Another warning is that momentum has turned lower and the 20-day MA has crossed below the 50-day MA. But all this is of little concern as long as the recent lows at 297.45 hold.

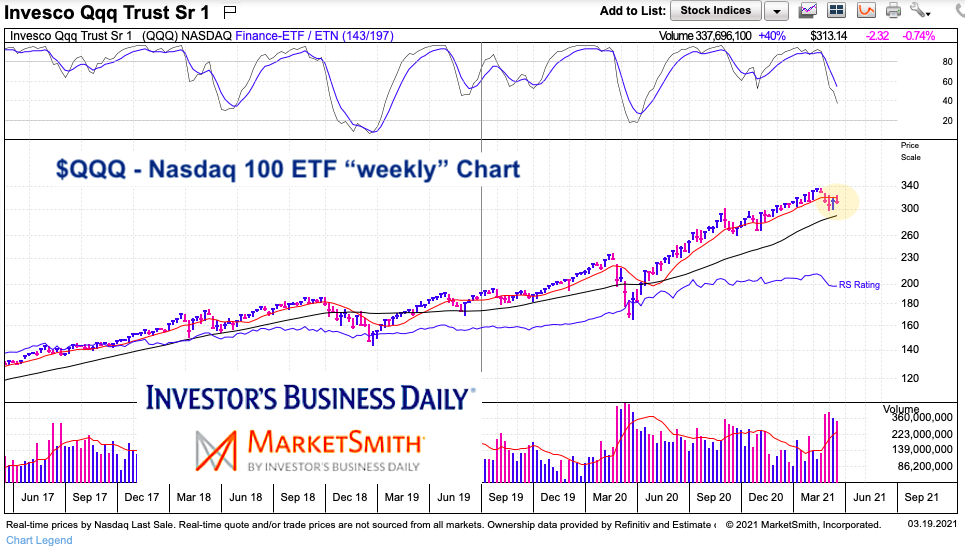
$QQQ – Nasdaq 100 ETF “weekly” Chart
On the weekly chart, we can see that momentum continues to slide. It also shows how strong the up-trend has been (and thus, why a sharp correction here would be totally within reason). Note that the 38.2 Fibonacci retracement from last Spring’s low is around $272. So if $297 fails to hold, then a drop to $272-$282 seems within reason.

Twitter: @andrewnyquist
The author may have a position in mentioned securities at the time of publication. Any opinions expressed herein are solely those of the author, and do not in any way represent the views or opinions of any other person or entity.


