New year, new start. Tech stocks are finally showing signs of life and stock market bulls couldn’t be happier.
And it couldn’t come at a better time!
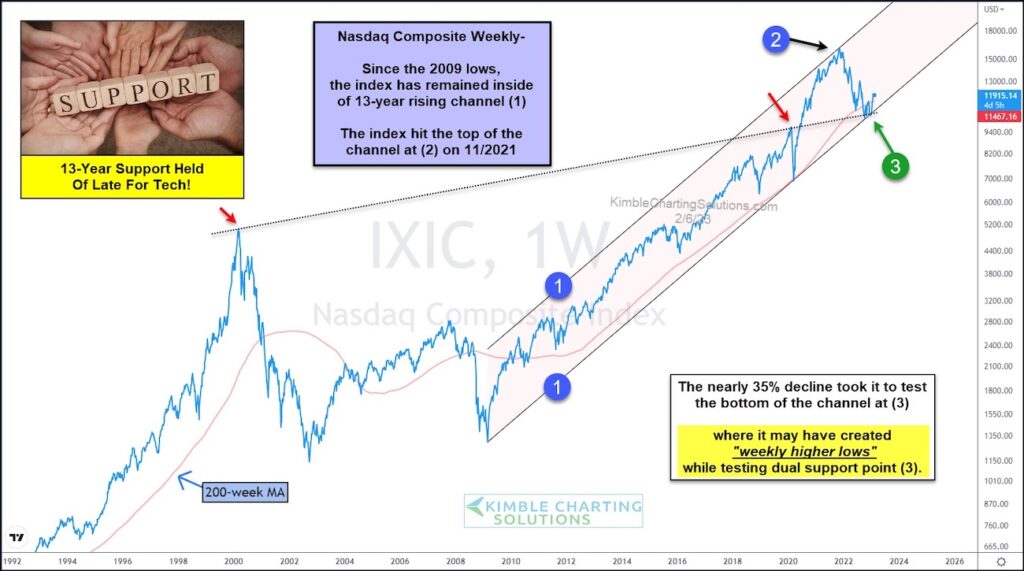
Today “weekly” chart of the Nasdaq Composite highlights this reversal of fortune and imparts some wisdom about trend lines and support.
As you can see, the Nasdaq has been in a 13 year rising trend; see its trend channel marked by each (1). It touched the top of this channel at (2) and began a steep decline into last year. More recently, however, it looks to have tested its 13-year rising trend support at (3), where it appears to have created a higher low.
Strength of late has the Nasdaq trading back above its 200-week moving average line. If this major tech index can hold above this moving average and trend support, it would be bullish for the market’s prospects this year. Stay tuned!
Nasdaq Composite “weekly” Chart

Note that KimbleCharting is offering a 2 week Free trial to See It Market readers. Just send me an email to services@kimblechartingsolutions.com for details to get set up.
Twitter: @KimbleCharting
Any opinions expressed herein are solely those of the author, and do not in any way represent the views or opinions of any other person or entity.


